U-тест Манна Уитни по программированию на языке R
Популярным непараметрическим (без распределения) тестом для сравнения результатов между двумя независимыми группами является U-критерий Манна-Уитни . При сравнении двух независимых выборок, когда результат не имеет нормального распределения и выборки малы, уместен непараметрический тест. Он используется, чтобы увидеть разницу в распределении между двумя независимыми переменными на основе порядковой (категориальная переменная, имеющая внутренний порядок или ранг) зависимой переменной. Этот тест очень легко выполнить в программировании на R.
Реализация в R
Let’s say we have two kinds of bulbs say orange and red in our data and these are divided on the day to day base prices. So here the base prices are dependent variable on the two categories which are red and orange. So we will try and analyze that if we want to buy a red or orange color bulb which should we prefer on the basis of prices. If both the distributions are the same then this means that the null hypothesis (means no significant difference between the two) is true and we can buy any one of them and prices won’t matter. To understand the concept of the Mann Whitney U Test one needs to know what is the p-value. This value actually tells if we can reject our null hypothesis(0.5) or not. Now below is the implementation of the above example.
Approach
- Make a dataframe with two categorical variables in which one would be an ordinal type.
- After this, check the summary of the non-ordinal categorical variable by loading a package dplyr and summarise() to get median values using median() and passing bulb_prices column, IQR-inter-quartile range, and count of both the groups i.e red and orange bulb.
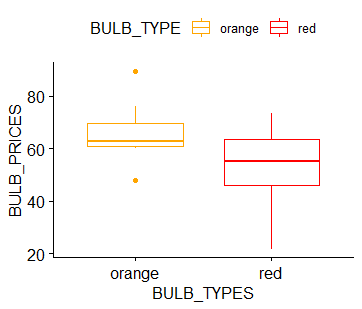
- Then look at the Boxplot and see the distribution of the data with the help of installing a package ggpubr and using the ggboxplot() and passing the columns as arguments in x and y and giving them color with help of palette and passing the color codes.
- Then finally apply the function wilcox.test() to get the p-value.
- If the p-value is found to be less than 0.5 then the null hypothesis will be rejected.
- If we found the value to be greater than 0.5 then the null hypothesis will be accepted.
- wilcox.test() function takes both categorical variables,dataframe as an argument, and gives us the hypothesis p-value.
R
# R program to illustrate# Mann Whitney U Test # Creating a small dataset# Creating a vector of red bulb and orange pricesred_bulb <- c(38.9, 61.2, 73.3, 21.8, 63.4, 64.6, 48.4, 48.8)orange_bulb <- c(47.8, 60, 63.4, 76, 89.4, 67.3, 61.3, 62.4) # Passing them in the columnsBULB_PRICE = c(red_bulb, orange_bulb)BULB_TYPE = rep(c("red", "orange"), each = 8) # Now creating a dataframe DATASET <- data.frame(BULB_TYPE, BULB_PRICE, stringsAsFactors = TRUE) # printing the dataframeDATASET # installing libraries to view summaries and# boxplot of both orange and red color bulbsinstall.packages("dplyr")install.packages("ggpubr") # Summary of the data # loading the packagelibrary(dplyr)group_by(DATASET,BULB_TYPE) %>% summarise( count = n(), median = median(BULB_PRICE, na.rm = TRUE), IQR = IQR(BULB_PRICE, na.rm = TRUE)) # loading package for boxplotlibrary("ggpubr")ggboxplot(DATASET, x = "BULB_TYPE", y = "BULB_PRICE", color = "BULB_TYPE", palette = c("#FFA500", "#FF0000"), ylab = "BULB_PRICES", xlab = "BULB_TYPES") res <- wilcox.test(BULB_PRICE~ BULB_TYPE, data = DATASET, exact = FALSE)res |
Выход:
- > НАБОР ДАННЫХ
 BULB_TYPE BULB_PRICE
1 красный 38,9
2 красных 61,2
3 красный 73,3
4 красный 21,8
5 красный 63,4
6 красный 64,6
7 красный 48,4
8 красный 48,8
9 оранжевый 47,8
10 апельсин 60,0
11 оранжевый 63,4
12 оранжевый 76,0
13 оранжевый 89,4
14 оранжевый 67,3
15 оранжевый 61,3
16 оранжевый 62,4
- # сводка данных
 summarize () `разгруппировать вывод (переопределить аргументом` .groups`)
# Стол: 2 х 4
  BULB_TYPE подсчитать средний IQR
  <fct> <int> <dbl> <dbl>
1 апельсин 8 62,9 8,5
2 красный 8 55 17,7
- # boxplot
- > res
 Тест суммы рангов Вилкоксона с поправкой на непрерывность

данные: BULB_PRICE от BULB_TYPE
W = 44,5, значение p = 0,2072
альтернативная гипотеза: истинное смещение местоположения не равно 0
Объяснение:
Здесь, как мы видим, значение p оказывается равным 0,2072, что намного меньше нулевой гипотезы (0,5) . В связи с чем он будет отклонен. И можно сделать вывод, что распределение цен на красные и оранжевые лампочки неодинаково. Из-за чего нельзя сказать, что если выгодно покупать любую из вышеперечисленных лампочек, выгодно.