Визуализация графиков в KDE с помощью Pandas и Seaborn
График KDE, описанный как Оценка плотности ядра , используется для визуализации плотности вероятности непрерывной переменной. Он отображает плотность вероятности при различных значениях непрерывной переменной. Мы также можем построить один график для нескольких выборок, что помогает в более эффективной визуализации данных.
В этой статье мы будем использовать набор данных Iris и график KDE для визуализации информации о наборе данных.
О наборе данных Iris -
- Атрибуты : Длина_ лепестка (см), ширина_ лепестка (см), длина_ сепала (см), ширина_ чаши (см)
- Цель : Iris_Virginica, Iris_Setosa, Iris_Vercicolor
- Количество экземпляров : 150
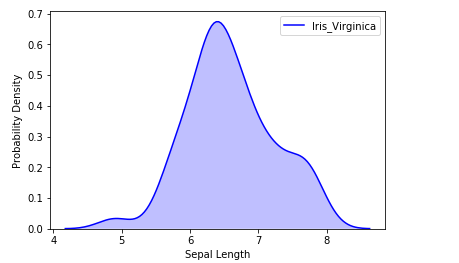
Одномерный график KDE:
Мы можем визуализировать распределение вероятностей выборки по одному непрерывному атрибуту.
# importing the required librariesfrom sklearn import datasetsimport pandas as pdimport seaborn as snsimport matplotlib.pyplot as plt%matplotlib inline # Setting up the Data Frameiris = datasets.load_iris() iris_df = pd.DataFrame(iris.data, columns=["Sepal_Length", "Sepal_Width", "Patal_Length", "Petal_Width"]) iris_df["Target"] = iris.target iris_df["Target"].replace([0], "Iris_Setosa", inplace=True)iris_df["Target"].replace([1], "Iris_Vercicolor", inplace=True)iris_df["Target"].replace([2], "Iris_Virginica", inplace=True) # Plotting the KDE Plotsns.kdeplot(iris_df.loc[(iris_df["Target"]=="Iris_Virginica"), "Sepal_Length"], color="b", shade=True, Label="Iris_Virginica") # Setting the X and Y Labelplt.xlabel("Sepal Length")plt.ylabel("Probability Density") |
Output:
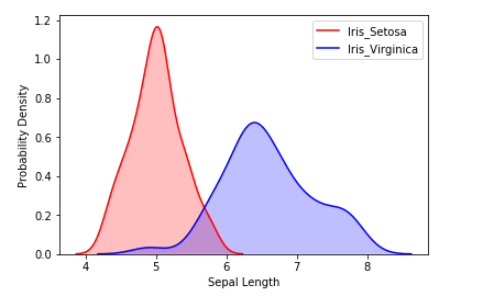
We can also visualize the probability distribution of multiple samples in a single plot.
# Plotting the KDE Plotsns.kdeplot(iris_df.loc[(iris_df["Target"]=="Iris_Setosa"), "Sepal_Length"], color="r", shade=True, Label="Iris_Setosa") sns.kdeplot(iris_df.loc[(iris_df["Target"]=="Iris_Virginica"), "Sepal_Length"], color="b", shade=True, Label="Iris_Virginica") plt.xlabel("Sepal Length")plt.ylabel("Probability Density") |
Output:
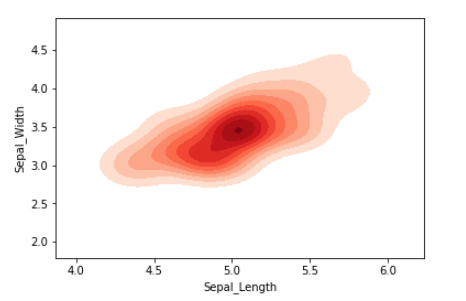
Two-Dimensional KDE Plot :
We can visualize the probability distribution of a sample against multiple continuous attributes.
# Setting up the samplesiris_setosa = iris_df.query("Target=="Iris_Setosa"")iris_virginica = iris_df.query("Target=="Iris_Virginica"") # Plotting the KDE Plotsns.kdeplot(iris_setosa["Sepal_Length"], iris_setosa["Sepal_Width"], color="r", shade=True, Label="Iris_Setosa", cmap="Reds", shade_lowest=False) |
Output:
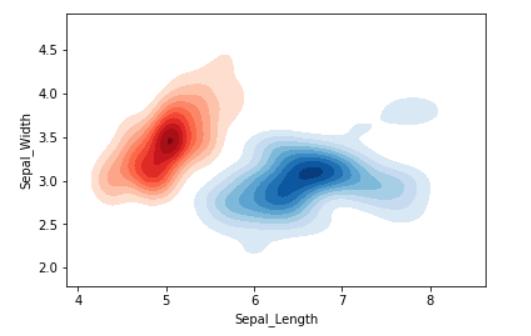
We can also visualize the probability distribution of multiple samples in a single plot.
# Plotting the KDE Plotsns.kdeplot(iris_setosa["Sepal_Length"], iris_setosa["Sepal_Width"], color="r", shade=True, Label="Iris_Setosa", cmap="Reds", shade_lowest=False) sns.kdeplot(iris_virginica["Sepal_Length"], iris_virginica["Sepal_Width"], color="b", shade=True, Label="Iris_Virginica", cmap="Blues", shade_lowest=False) |
Выход: 
Внимание компьютерщик! Укрепите свои основы с помощью базового курса программирования Python и изучите основы.
Для начала подготовьтесь к собеседованию. Расширьте свои концепции структур данных с помощью курса Python DS. А чтобы начать свое путешествие по машинному обучению, присоединяйтесь к курсу Машинное обучение - базовый уровень.