ML | Реализация регуляризации L1 и L2 с помощью Sklearn
Опубликовано: 24 Июля, 2021
Предпосылки: регуляризация L2 и L1
Эта статья направлена на реализацию регуляризации L2 и L1 для линейной регрессии с использованием модулей Ridge и Lasso библиотеки Sklearn Python.
Набор данных - набор данных о ценах на жилье.
Шаг 1. Импорт необходимых библиотек
Python3
import pandas as pdimport numpy as npimport matplotlib.pyplot as pltfrom sklearn.linear_model import LinearRegression, Ridge, Lassofrom sklearn.model_selection import train_test_split, cross_val_scorefrom mean import statistics |
Шаг 2. Загрузка и очистка данных
Python3
# Changing the working location to the location of the datacd C:UsersDevDesktopKaggleHouse Prices# Loading the data into a Pandas DataFramedata = pd.read_csv( 'kc_house_data.csv' )# Dropping the numerically non-sensical variablesdropColumns = [ 'id' , 'date' , 'zipcode' ]data = data.drop(dropColumns, axis = 1 )# Separating the dependent and independent variablesy = data[ 'price' ]X = data.drop( 'price' , axis = 1 )# Dividing the data into training and testing setX_train, X_test, y_train, y_test = train_test_split(X, y, test_size = 0.25 ) |
Шаг 3. Построение и оценка различных моделей
а) Линейная регрессия:
Python3
# Building and fitting the Linear Regression modellinearModel = LinearRegression()linearModel.fit(X_train, y_train)# Evaluating the Linear Regression modelprint(linearModel.score(X_test, y_test)) |

б) Ридж (L2) регрессия:
Python3
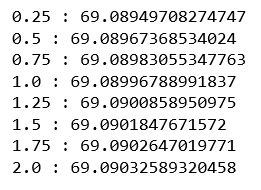
# List to maintain the different cross-validation scorescross_val_scores_ridge = []# List to maintain the different values of alphaalpha = []# Loop to compute the different values of cross-validation scoresfor i in range ( 1 , 9 ): ridgeModel = Ridge(alpha = i * 0.25 ) ridgeModel.fit(X_train, y_train) scores = cross_val_score(ridgeModel, X, y, cv = 10 ) avg_cross_val_score = mean(scores) * 100 cross_val_scores_ridge.append(avg_cross_val_score) alpha.append(i * 0.25 )# Loop to print the different values of cross-validation scoresfor i in range ( 0 , len (alpha)): print ( str (alpha[i]) + ' : ' + str (cross_val_scores_ridge[i])) |

Из вышеприведенного вывода мы можем сделать вывод, что наилучшее значение альфа для данных - 2.
Python3
# Building and fitting the Ridge Regression modelridgeModelChosen = Ridge(alpha = 2 )ridgeModelChosen.fit(X_train, y_train)# Evaluating the Ridge Regression modelprint (ridgeModelChosen.score(X_test, y_test)) |

в) Лассо (L1) Регрессия:
Python3
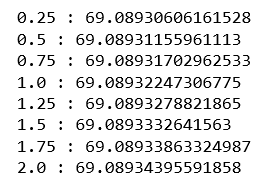
# List to maintain the cross-validation scorescross_val_scores_lasso = []# List to maintain the different values of LambdaLambda = []# Loop to compute the cross-validation scoresfor i in range ( 1 , 9 ): lassoModel = Lasso(alpha = i * 0.25 , tol = 0.0925 ) lassoModel.fit(X_train, y_train) scores = cross_val_score(lassoModel, X, y, cv = 10 ) avg_cross_val_score = mean(scores) * 100 cross_val_scores_lasso.append(avg_cross_val_score) Lambda.append(i * 0.25 )# Loop to print the different values of cross-validation scoresfor i in range ( 0 , len (alpha)): print ( str (alpha[i]) + ' : ' + str (cross_val_scores_lasso[i])) |

Из приведенного выше вывода мы можем сделать вывод, что наилучшее значение лямбды равно 2.
Python3
# Building and fitting the Lasso Regression ModellassoModelChosen = Lasso(alpha = 2 , tol = 0.0925 )lassoModelChosen.fit(X_train, y_train)# Evaluating the Lasso Regression modelprint (lassoModelChosen.score(X_test, y_test)) |

Шаг 4: Сравнение и визуализация результатов
Python3
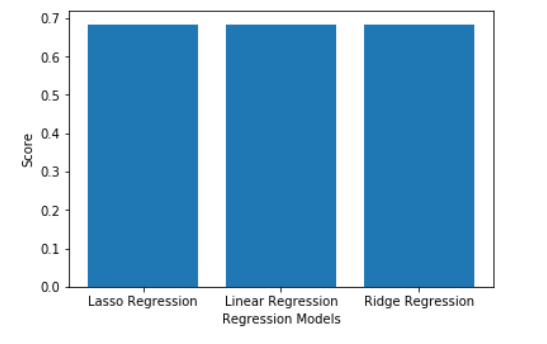
# Building the two lists for visualizationmodels = [ 'Linear Regression' , 'Ridge Regression' , 'Lasso Regression' ]scores = [linearModel.score(X_test, y_test), ridgeModelChosen.score(X_test, y_test), lassoModelChosen.score(X_test, y_test)]# Building the dictionary to compare the scoresmapping = {}mapping[ 'Linear Regreesion' ] = linearModel.score(X_test, y_test)mapping[ 'Ridge Regreesion' ] = ridgeModelChosen.score(X_test, y_test)mapping[ 'Lasso Regression' ] = lassoModelChosen.score(X_test, y_test)# Printing the scores for different modelsfor key, val in mapping.items(): print ( str (key) + ' : ' + str (val)) |

Python3
# Plotting the scoresplt.bar(models, scores)plt.xlabel( 'Regression Models' )plt.ylabel( 'Score' )plt.show() |
