Swarmplot с использованием Seaborn на Python
Seaborn - это потрясающая библиотека визуализации для построения статистических графиков на Python. Он предоставляет красивые стили и цветовые палитры по умолчанию, чтобы сделать статистические графики более привлекательными. Он построен на основе библиотеки matplotlib, а также тесно интегрирован в структуры данных из pandas.
Участок роя
Swarmplot Seaborn, вероятно, похож на stripplot, только точки настроены так, чтобы они не перекрывались друг с другом, поскольку это помогает лучше представить распределение значений. График роя может быть нарисован сам по себе, но он также является хорошим дополнением к рамке, предпочтительно, потому что связанные имена будут использоваться для аннотирования осей. Этот тип сюжета иногда называют «пчелиным грелом».
Syntax: seaborn.swarmplot(x=None, y=None, hue=None, data=None, order=None, hue_order=None, dodge=False, orient=None, color=None, palette=None, size=5, edgecolor=’gray’, linewidth=0, ax=None, **kwargs)
Parameters:
x, y, hue: Inputs for plotting long-form data.
data: Dataset for plotting.
color: Color for all of the elements
size: Radius of the markers, in points.
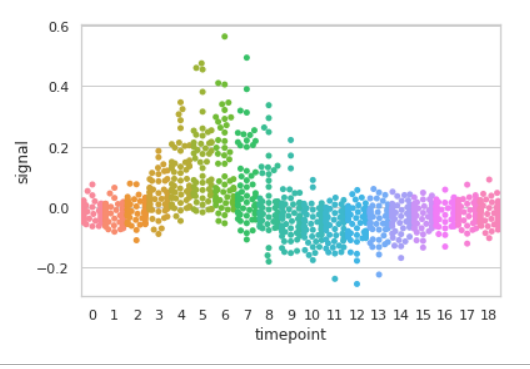
Пример 1: Базовая визуализация набора данных «fmri» с помощью swarmplot ()
Python3
import seabornseaborn.set(style="whitegrid")fmri = seaborn.load_dataset("fmri")seaborn.swarmplot(x="timepoint", y="signal", data=fmri) |
Выход:
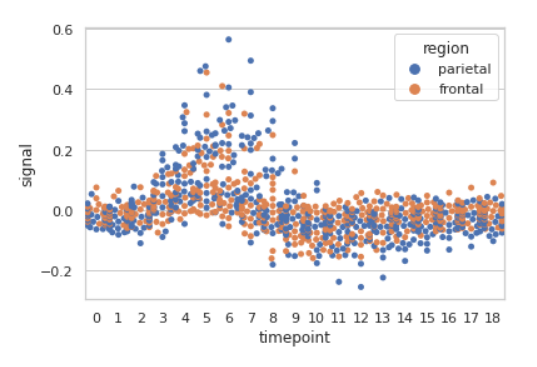
Example 2: Grouping data points on the basis of category, here as region and event.
Python3
import seabornseaborn.set(style="whitegrid")fmri = seaborn.load_dataset("fmri")seaborn.swarmplot(x="timepoint", y="signal", hue="region", data=fmri) |
Выход:
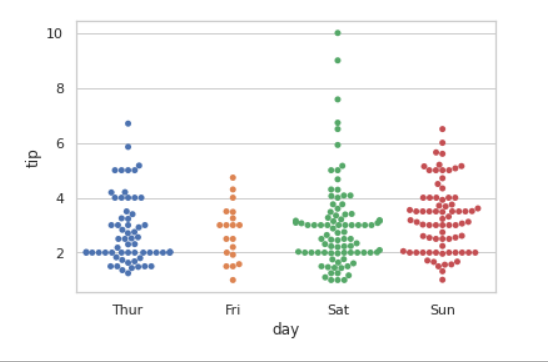
Пример 3: Базовая визуализация набора данных «подсказок» с помощью swarmplot ()
Python3
import seabornseaborn.set(style="whitegrid")tip = seaborn.load_dataset("tips")seaborn.swarmplot(x="day", y="tip", data=tip) |
Выход:
Группировка переменных в Seaborn Swarmplot с разными атрибутами
1. Нарисуйте один горизонтальный график роя, используя только одну ось:
Если мы используем только одну переменную данных вместо двух переменных данных, это означает, что ось обозначает каждую из этих переменных данных как ось.
X обозначает ось x, а y обозначает ось y.
Syntax:
seaborn.swarmplot(x)
Python3
# Python program to illustrate# swarmplot using inbuilt data-set# given in seaborn # importing the required moduleimport seaborn# use to set style of background of plotseaborn.set(style="whitegrid")# loading data-settips = seaborn.load_dataset("tips")seaborn.swarmplot(x=tips["total_bill"]) |
Выход:
2. Нарисуйте горизонтальные рои:
In the above example we see how to plot single horizontal swarm plot and here can perform multiple horizontal swarm plot with exchange the data variable with another axis.
Python3
# Python program to illustrate# swarmplot using inbuilt data-set# given in seaborn # importing the required moduleimport seaborn# use to set style of background of plotseaborn.set(style="whitegrid")# loading data-settips = seaborn.load_dataset("tips")seaborn.swarmplot(x="total_bill", y="day", data=tips) |
Выход:
3. Использование параметра оттенка:
Хотя точки нанесены на график в двух измерениях, к графику можно добавить еще одно измерение, раскрасив точки в соответствии с третьей переменной.
Syntax:
sns.swarmplot(x, y, hue, data);
Python3
# Python program to illustrate# swarmplot using inbuilt data-set# given in seaborn # importing the required moduleimport seaborn# use to set style of background of plotseaborn.set(style="whitegrid")# loading data-settips = seaborn.load_dataset("tips")seaborn.swarmplot(x="day", y="total_bill", hue="time", data=tips) |
Выход:
4. Нарисуйте контуры вокруг точек данных, используя ширину линии:
Ширина серых линий, обрамляющих элементы графика. Каждый раз, когда мы увеличиваем ширину линии, точка также будет увеличиваться автоматически.
Syntax:
seaborn.swarmplot(x, y, data, linewidth)
Python3
# Python program to illustrate# swarmplot using inbuilt data-set# given in seaborn # importing the required moduleimport seaborn# use to set style of background of plotseaborn.set(style="whitegrid")# loading data-settips = seaborn.load_dataset("tips")seaborn.swarmplot(x="day", y="total_bill", data=tips, linewidth=2) |
Выход:
We can change the color with edgecolor:
Python3
seaborn.swarmplot(y="total_bill", x="day", data=tips, linewidth=2,edgecolor="green") |
Выход:
5. Нарисуйте каждый уровень переменной оттенка в разных местах на главной категориальной оси:
При использовании вложения оттенков для параметра «Осветление» должно быть установлено значение «Истина», чтобы разделить точки для разных уровней оттенков вдоль категориальной оси. Палитра используется для разных уровней переменной оттенка.
Syntax:
seaborn.stripplot(x, y, data, hue, palette, dodge)
Python3
# Python program to illustrate# swarmplot using inbuilt data-set# given in seaborn # importing the required moduleimport seaborn# use to set style of background of plotseaborn.set(style="whitegrid")# loading data-settips = seaborn.load_dataset("tips")seaborn.swarmplot(x="day", y="total_bill", hue="smoker", data=tips, palette="Set2", dodge=True) |
Выход:
Possible values of palette are:
Accent, Accent_r, Blues, Blues_r, BrBG, BrBG_r, BuGn, BuGn_r, BuPu, BuPu_r, CMRmap, CMRmap_r, Dark2, Dark2_r,
GnBu, GnBu_r, Greens, Greens_r, Greys, Greys_r, OrRd, OrRd_r, Oranges, Oranges_r, PRGn, PRGn_r, Paired, Paired_r,
Pastel1, Pastel1_r, Pastel2, Pastel2_r, PiYG, PiYG_r, PuBu, PuBuGn, PuBuGn_r, PuBu_r, PuOr, PuOr_r, PuRd, PuRd_r,
Purples, Purples_r, RdBu, RdBu_r, RdGy, RdGy_r, RdPu, RdPu_r, RdYlBu, RdYlBu_r, RdYlGn, RdYlGn_r, Reds, Reds_r, Set1,
Set1_r, Set2, Set2_r, Set3, Set3_r, Spectral, Spectral_r, Wistia, Wistia_r, YlGn, YlGnBu, YlGnBu_r, YlGn_r, YlOrBr,
YlOrBr_r, YlOrRd, YlOrRd_r, afmhot, afmhot_r, autumn, autumn_r, binary, binary_r, bone, bone_r, brg, brg_r, bwr, bwr_r,
cividis, cividis_r, cool, cool_r, coolwarm, coolwarm_r, copper, copper_r, cubehelix, cubehelix_r, flag, flag_r, gist_earth,
gist_earth_r, gist_gray, gist_gray_r, gist_heat, gist_heat_r, gist_ncar, gist_ncar_r, gist_rainbow, gist_rainbow_r, gist_stern,
6. Нанесение больших точек и разной эстетики с маркером и параметром альфа:
We will use alpha to manage transparency of the data point, and use marker for marker to customize the data point.
Python3
# Python program to illustrate# swarmplot using inbuilt data-set# given in seaborn # importing the required moduleimport seaborn# use to set style of background of plotseaborn.set(style="whitegrid")# loading data-settips = seaborn.load_dataset("tips")seaborn.swarmplot(x="day", y="total_bill", hue="smoker", data=tips, palette="Set2", size=20, marker="D", edgecolor="gray", alpha=.25) |
Выход:
7. Control swarm order by passing an explicit order:
Python3
# Python program to illustrate# swarmplot using inbuilt data-set# given in seaborn # importing the required moduleimport seaborn# use to set style of background of plotseaborn.set(style="whitegrid")# loading data-settips = seaborn.load_dataset("tips")seaborn.swarmplot(x="time", y="tip", data=tips, order=["Dinner", "Lunch"]) |
Выход:
8. Добавление атрибутов размера.
Используя размер, мы можем создать точку и точки разных размеров.
Syntax:
seaborn.swramplot( x, y, data, size)
Python3
# Python program to illustrate# swarmplot using inbuilt data-set# given in seaborn# importing the required moduleimport seaborn# use to set style of background of plotseaborn.set(style="whitegrid")# loading data-settips = seaborn.load_dataset("tips")seaborn.swarmplot(x="day", y="total_bill", data=tips, hue="smoker", size=10) |
Выход:
9. Добавление атрибутов палитры:
Using the palette we can generate the point with different colors. In this below example we can see the palette can be responsible for a generate the swramplot with different colormap values.
Syntax:
seaborn.swramplot( x, y, data, palette=”color_name”)
Python3
# Python program to illustrate# swarmplot using inbuilt data-set# given in seaborn# importing the required moduleimport seaborn# use to set style of background of plotseaborn.set(style="whitegrid")# loading data-settips = seaborn.load_dataset("tips")seaborn.swarmplot(x="day", y="total_bill", data=tips, hue="time", palette="pastel") |
Выход:
Внимание компьютерщик! Укрепите свои основы с помощью базового курса программирования Python и изучите основы.
Для начала подготовьтесь к собеседованию. Расширьте свои концепции структур данных с помощью курса Python DS. А чтобы начать свое путешествие по машинному обучению, присоединяйтесь к курсу Машинное обучение - базовый уровень.