Создание фрейма данных из серии Pandas
Серии - это тип списка в пандах, который может принимать целочисленные значения, строковые значения, значения типа double и многое другое. Но в Pandas Series мы возвращаем объект в виде списка с индексом от 0 до n , где n - длина значений в серии.
Позже в этой статье мы обсудим фреймы данных в пандах, но сначала нам нужно понять основное различие между сериями и фреймами данных. Серии могут содержать только один список с индексом, тогда как фрейм данных может состоять из нескольких серий, или мы можем сказать, что фрейм данных - это набор серий, которые можно использовать для анализа данных.
Code #1: Creating a simple Series
import pandas as pdimport matplotlib.pyplot as plt author = ["Jitender", "Purnima", "Arpit", "Jyoti"] auth_series = pd.Series(author)print(auth_series) |
Выход:
0 Джитендер
1 пурнима
2 Арпит
3 Джиоти
dtype: объект
Проверим тип серии:
Выход:
<класс 'pandas.core.series.Series'>
Code #2: Creating Dataframe from Series
import pandas as pdimport matplotlib.pyplot as plt author = ["Jitender", "Purnima", "Arpit", "Jyoti"]article = [210, 211, 114, 178] auth_series = pd.Series(author)article_series = pd.Series(article) frame = { "Author": auth_series, "Article": article_series } result = pd.DataFrame(frame) print(result) |
Выход:
     Автор статьи
0 Джитендер 210
1 пурнима 211
2 Арпит 114
3 Джоти 178
Explanation:
We are combining two series Author and Article published. Create a dictionary so that we can combine the metadata for series. Metadata is the data of data that can define the series of values. Pass this dictionary to pandas DataFrame and finally you can see the result as combination of two series i.e for author and number of articles.
Code #3: How to add series externally in dataframe
import pandas as pdimport matplotlib.pyplot as plt author = ["Jitender", "Purnima", "Arpit", "Jyoti"]article = [210, 211, 114, 178] auth_series = pd.Series(author)article_series = pd.Series(article) frame = { "Author": auth_series, "Article": article_series } result = pd.DataFrame(frame)age = [21, 21, 24, 23] result["Age"] = pd.Series(age) print(result) |
Выход:
     Автор статьи Возраст
0 Джитендер 210 21
1 Пурнима 211 21
2 Арпит 114 24
3 Джоти 178 23
Explanation:
We have added one more series externally named as age of the authors, then directly added this series in the pandas dataframe. Remember one thing if any value is missing then by default it will be converted into NaN value i.e null by default.
Code #4: Missing value in dataframe
import pandas as pdimport matplotlib.pyplot as plt author = ["Jitender", "Purnima", "Arpit", "Jyoti"]article = [210, 211, 114, 178] auth_series = pd.Series(author)article_series = pd.Series(article) frame = { "Author": auth_series, "Article": article_series } result = pd.DataFrame(frame)age = [21, 21, 23] result["Age"] = pd.Series(age) print(result) |
Выход:
     Автор статьи Возраст
0 Джитендер 210 21,0
1 пурнима 211 21,0
2 Арпит 114 23,0
3 Джоти 178 NaN
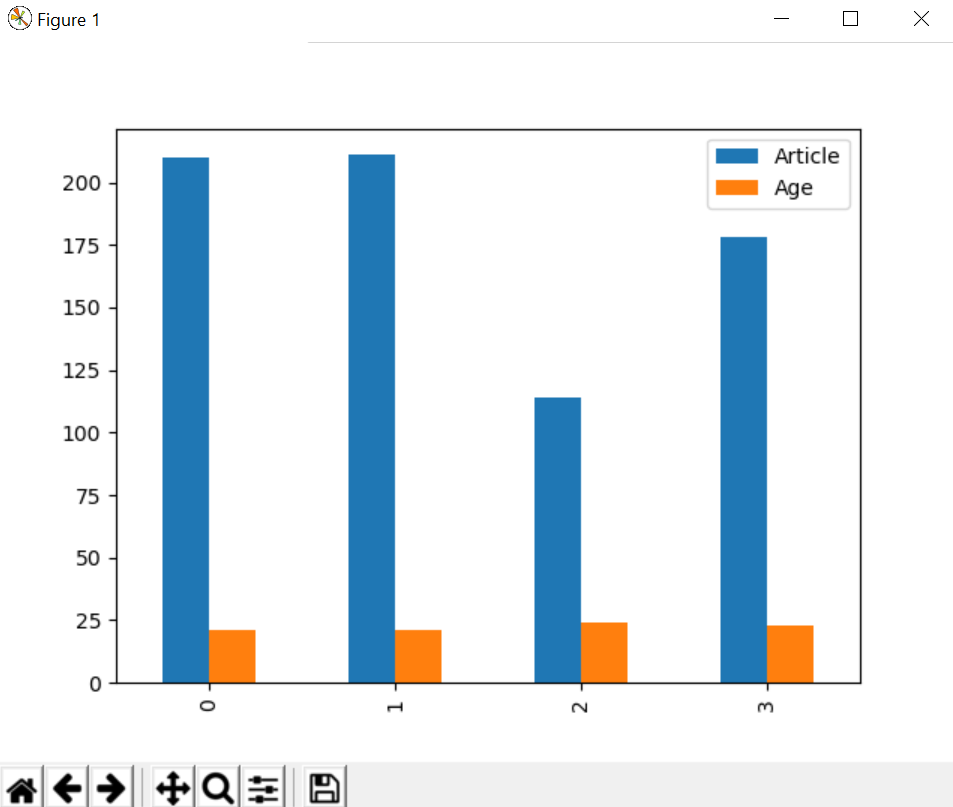
Код # 5: график данных на графике
Using plot.bar() we have created a bar graph.
import pandas as pdimport matplotlib.pyplot as plt author = ["Jitender", "Purnima", "Arpit", "Jyoti"]article = [210, 211, 114, 178] auth_series = pd.Series(author)article_series = pd.Series(article) frame = { "Author": auth_series, "Article": article_series } result = pd.DataFrame(frame)age = [21, 21, 24, 23] result["Age"] = pd.Series(age) result.plot.bar()plt.show() |
Выход:
Внимание компьютерщик! Укрепите свои основы с помощью базового курса программирования Python и изучите основы.
Для начала подготовьтесь к собеседованию. Расширьте свои концепции структур данных с помощью курса Python DS. А чтобы начать свое путешествие по машинному обучению, присоединяйтесь к курсу Машинное обучение - базовый уровень.