Случайное блуждание (реализация на Python)
Введение Случайное блуждание - это математический объект, известный как случайный или случайный процесс, который описывает путь, состоящий из последовательности случайных шагов в некотором математическом пространстве, таком как целые числа. Элементарным примером случайного блуждания является случайное блуждание по целочисленной строке, которое начинается с 0 и на каждом шаге перемещается на +1 или -1 с равной вероятностью. Другие примеры включают в себя путь, пройденный молекулой при ее перемещении в жидкости или газе, путь поиска животного-добытчика, цена колеблющегося запаса и финансовое положение игрока - все это может быть приблизительно определено моделями случайного блуждания, даже хотя в действительности они могут быть не случайными. Как показано на этих примерах, случайные блуждания применяются во многих областях науки, включая экологию, психологию, информатику, физику, химию, биологию, а также экономику. Случайные блуждания объясняют наблюдаемое поведение многих процессов в этих полях и, таким образом, служат фундаментальной моделью для зарегистрированной стохастической активности. В качестве более математического приложения значение пи может быть аппроксимировано использованием случайного блуждания в среде агентного моделирования.
Хватит скучной теории. Давайте сделаем перерыв, чтобы немного познакомиться с кодом. Итак, чтобы закодировать случайное блуждание, нам в основном потребуются некоторые библиотеки в Python, некоторые для выполнения математики, а некоторые другие для построения кривой.
Libraries Required
- matplotlib Its a external library which help you to plot the curve. To install this library type the following code in you cmd.
pip install matplotlib
It would be enough to get you through the installation.
- numpy It’s also an external library in python it helps you to work with array and matrices. To install the library type the following code in cmd.
pip install numpy
- random It’s a built-in library of python we will use it to generate random points.
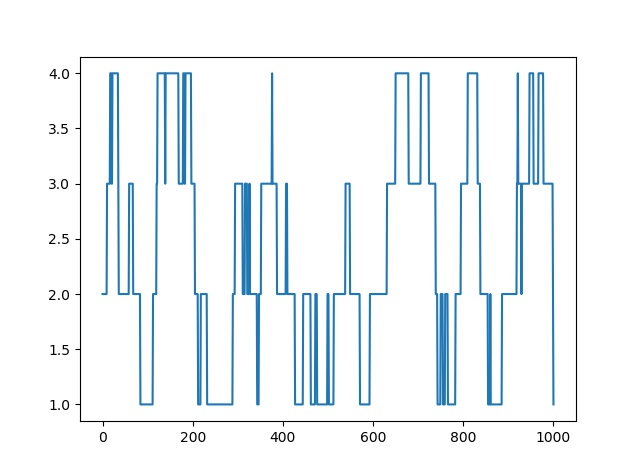
One-dimensional random walk An elementary example of a random walk is the random walk on the integer number line, which starts at 0 and at each step moves +1 or ?1 with equal probability.
So lets try to implement the 1-D random walk in python.
# Python code for 1-D random walk.import randomimport numpy as npimport matplotlib.pyplot as plt # Probability to move up or downprob = [0.05, 0.95] # statically defining the starting positionstart = 2 positions = [start] # creating the random pointsrr = np.random.random(1000)downp = rr < prob[0]upp = rr > prob[1] for idownp, iupp in zip(downp, upp): down = idownp and positions[-1] > 1 up = iupp and positions[-1] < 4 positions.append(positions[-1] - down + up) # plotting down the graph of the random walk in 1Dplt.plot(positions)plt.show() |
Output:
Higher dimensions In higher dimensions, the set of randomly walked points has interesting geometric properties. In fact, one gets a discrete fractal, that is, a set which exhibits stochastic self-similarity on large scales. On small scales, one can observe “jaggedness” resulting from the grid on which the walk is performed. Two books of Lawler referenced below are a good source on this topic. The trajectory of a random walk is the collection of points visited, considered as a set with disregard to when the walk arrived at the point. In one dimension, the trajectory is simply all points between the minimum height and the maximum height the walk achieved (both are, on average, on the order of ?n).
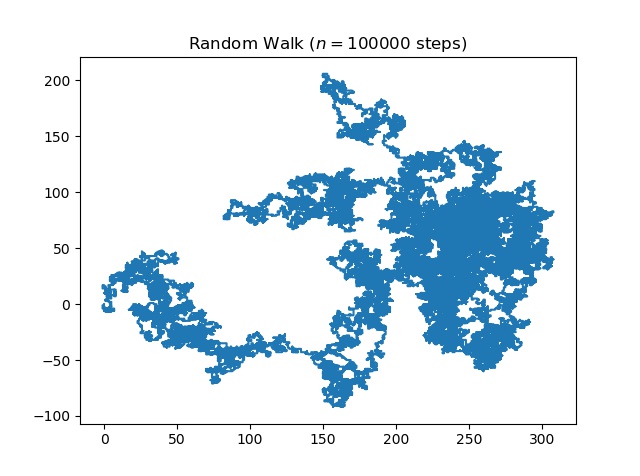
Let’s try to create random walk in 2D.
# Python code for 2D random walk.import numpyimport pylabimport random # defining the number of stepsn = 100000 #creating two array for containing x and y coordinate#of size equals to the number of size and filled up with 0"sx = numpy.zeros(n)y = numpy.zeros(n) # filling the coordinates with random variablesfor i in range(1, n): val = random.randint(1, 4) if val == 1: x[i] = x[i - 1] + 1 y[i] = y[i - 1] elif val == 2: x[i] = x[i - 1] - 1 y[i] = y[i - 1] elif val == 3: x[i] = x[i - 1] y[i] = y[i - 1] + 1 else: x[i] = x[i - 1] y[i] = y[i - 1] - 1 # plotting stuff:pylab.title("Random Walk ($n = " + str(n) + "$ steps)")pylab.plot(x, y)pylab.savefig("rand_walk"+str(n)+".png",bbox_inches="tight",dpi=600)pylab.show() |
Output:
Applications
- In computer networks, random walks can model the number of transmission packets buffered at a server.
- In population genetics, random walk describes the statistical properties of genetic drift.
- In image segmentation, random walks are used to determine the labels (i.e., “object” or “background”) to associate with each pixel.
- In brain research, random walks and reinforced random walks are used to model cascades of neuron firing in the brain.
- Random walks have also been used to sample massive online graphs such as online social networks.
References
1. Wikipedia – Random Walk
2. Stackoverflow – Random Walk 1D
3. matplotlib documentation
This article is contributed by Subhajit Saha. If you like GeeksforGeeks and would like to contribute, you can also write an article using contribute.geeksforgeeks.org or mail your article to contribute@geeksforgeeks.org. See your article appearing on the GeeksforGeeks main page and help other Geeks.
Please write comments if you find anything incorrect, or you want to share more information about the topic discussed above.
Attention geek! Strengthen your foundations with the Python Programming Foundation Course and learn the basics.
To begin with, your interview preparations Enhance your Data Structures concepts with the Python DS Course. And to begin with your Machine Learning Journey, join the Machine Learning – Basic Level Course