PyQtGraph - Получение дочернего прямоугольника представления изображения
В этой статье мы увидим, как мы можем получить дочерний прямоугольник объекта просмотра изображения в PyQTGaph. PyQtGraph - это библиотека графики и пользовательского интерфейса для Python, которая обеспечивает функциональные возможности, обычно требуемые в приложениях для проектирования и науки. Его основные цели - предоставить быструю интерактивную графику для отображения данных (графики, видео и т. Д.). Виджет, используемый для отображения и анализа данных изображения. Реализует множество функций, таких как отображение данных 2D и 3D изображений. Для 3D-данных отображается ползунок оси Z, позволяющий пользователю выбрать, какой кадр будет отображаться. Отображает гистограмму данных изображения с подвижной областью, определяющей уровни темноты / света, редактируемый градиент предоставляет таблицу поиска цвета. Представление изображения - это группа виджетов, например, он содержит объект представления, кнопку и полосы прокрутки, прямоугольник дочерних элементов является ограничивающим прямоугольником дочерних элементов представления изображения.
Мы можем создать представление изображения с помощью команды, приведенной ниже
 # создание объекта просмотра изображения pyqtgraph
imv = pg.ImageView ()
Syntax: ImageView(parent=None, name=’ImageView’, view=None, imageItem=None, levelMode=’mono’, *args)
Parameters:
- parent (QWidget): Specifies the parent widget to which this ImageView will belong. If None, then the ImageView is created with no parent.
- name (str): The name used to register both the internal ViewBox and the PlotItem used to display ROI data.
- view (ViewBox or PlotItem): If specified, this will be used as the display area that contains the displayed image.
- imageItem (ImageItem): If specified, this object will be used to display the image. Must be an instance of ImageItem or other compatible object.
- levelMode: specifies the *levelMode* argument
Returns: Object of class ImageView
Для этого мы используем метод childrenRect () с объектом просмотра изображения.
Syntax : imv.childrenRect()
Argument : It takes no argument
Return : It returns QRect object
Below is the implementation
Python3
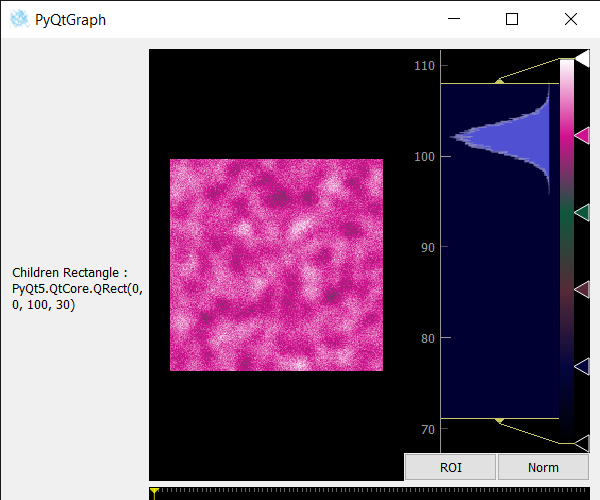
# importing Qt widgetsfrom PyQt5.QtWidgets import * # importing systemimport sys # importing numpy as npimport numpy as np # importing pyqtgraph as pgimport pyqtgraph as pgfrom PyQt5.QtGui import *from PyQt5.QtCore import * # Image View classclass ImageView(pg.ImageView): # constructor which inherit original # ImageView def __init__(self, *args, **kwargs): pg.ImageView.__init__(self, *args, **kwargs) class Window(QMainWindow): def __init__(self): super().__init__() # setting title self.setWindowTitle("PyQtGraph") # setting geometry self.setGeometry(100, 100, 600, 500) # icon icon = QIcon("skin.png") # setting icon to the window self.setWindowIcon(icon) # calling method self.UiComponents() # showing all the widgets self.show() # setting fixed size of window #self.setFixedSize(QSize(600, 500)) # method for components def UiComponents(self): # creating a widget object widget = QWidget() # creating a label label = QLabel("Geeksforgeeks Image View") # setting minimum width label.setMinimumWidth(130) # making label do word wrap label.setWordWrap(True) # setting configuration options pg.setConfigOptions(antialias=True) # creating image view view object imv = ImageView() # Create random 3D data set with noisy signals img = pg.gaussianFilter(np.random.normal(size=(200, 200)), (5, 5)) * 20 + 100 # setting new axis to image img = img[np.newaxis, :, :] # decay data decay = np.exp(-np.linspace(0, 0.3, 100))[:, np.newaxis, np.newaxis] # random data data = np.random.normal(size=(100, 200, 200)) data += img * decay data += 2 # adding time-varying signal sig = np.zeros(data.shape[0]) sig[30:] += np.exp(-np.linspace(1, 10, 70)) sig[40:] += np.exp(-np.linspace(1, 10, 60)) sig[70:] += np.exp(-np.linspace(1, 10, 30)) sig = sig[:, np.newaxis, np.newaxis] * 3 data[:, 50:60, 30:40] += sig # setting image to image view # Displaying the data and assign each frame a time value from 1.0 to 3.0 imv.setImage(data, xvals=np.linspace(1., 3., data.shape[0])) ## Set a custom color map colors = [ (0, 0, 0), (4, 5, 61), (84, 42, 55), (15, 87, 60), (208, 17, 141), (255, 255, 255) ] # color map cmap = pg.ColorMap(pos=np.linspace(0.0, 1.0, 6), color=colors) # setting color map to the image view imv.setColorMap(cmap) # Creating a grid layout layout = QGridLayout() # minimum width value of the label label.setFixedWidth(130) # setting this layout to the widget widget.setLayout(layout) # adding label in the layout layout.addWidget(label, 1, 0) # plot window goes on right side, spanning 3 rows layout.addWidget(imv, 0, 1, 3, 1) # setting this widget as central widget of the main widow self.setCentralWidget(widget) # getting children rectangle of image view value = imv.childrenRect() # setting text to the label label.setText("Children Rectangle : " + str(value)) # create pyqt5 appApp = QApplication(sys.argv) # create the instance of our Windowwindow = Window() # start the appsys.exit(App.exec()) |
Выход :
Внимание компьютерщик! Укрепите свои основы с помощью базового курса программирования Python и изучите основы.
Для начала подготовьтесь к собеседованию. Расширьте свои концепции структур данных с помощью курса Python DS. А чтобы начать свое путешествие по машинному обучению, присоединяйтесь к курсу Машинное обучение - базовый уровень.