Matplotlib.pyplot.subplot2grid () в Python
Matplotlib - потрясающая библиотека визуализации на Python для 2D-графиков массивов. Matplotlib - это многоплатформенная библиотека визуализации данных, построенная на массивах NumPy и предназначенная для работы с более широким стеком SciPy.
Matplotlib.pyplot.subplot2grid ()
Функция Matplotlib.pyplot.subplot2grid () дает дополнительную гибкость при создании объекта оси в указанном месте внутри сетки. Это также помогает распределить объект оси по нескольким строкам или столбцам. Проще говоря, эта функция используется для создания нескольких диаграмм на одном рисунке. Это менеджер компоновки субфигур.
Syntax : Plt.subplot2grid(shape, location, rowspan, colspan)
Parameters :
- shape: As the name suggests it is used to define the shape of the grid to be plotted within the graph. It is a required argument and is generally passed in as a list or tuple of two numbers which are responsible for the layout of the grid with the first number being the number of rows and the second number as the number of columns.
- location (loc): This is the second mandatory argument that this function takes. Similar to the shape argument it is also a required argument and is generally passed in as a list or tuple of two numbers. It is used for specifying the row and column number to place the sub-plot. It is also important to note that the indexes start from 0. So (0, 0) would be the cell in the first row and the first column of the grid.
- rowspan: Once the grid layout is set and the starting index is decided using location(loc) one can expand the selection to take up more rows with this argument. This is an optional parameter and has a default value of 1.
- colspan: Similar to rowspan it is used to expand the selection to take up more columns. It is also an optional parameter with default value of 1.
Пример 1:
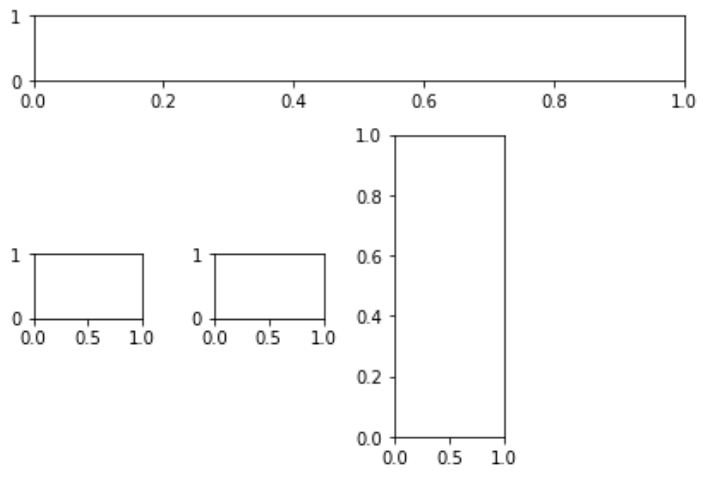
import matplotlib.pyplot as plt fig = plt.figure() axes1 = plt.subplot2grid((4, 4), (0, 0), colspan = 4) axes2 = plt.subplot2grid((4, 4), (1, 0), colspan = 3) axes3 = plt.subplot2grid((4, 4), (1, 2), rowspan = 3) axes4 = plt.subplot2grid((4, 4), (2, 0))axes5 = plt.subplot2grid((4, 4), (2, 1)) fig.tight_layout() |
Output :
Example 2:
import randomimport matplotlib.pyplot as pltfrom matplotlib import style style.use("fivethirtyeight") fig = plt.figure() # helper function to plot the linesdef helper(): xs = [] ys = [] for i in range(10): x = i y = random.randrange(10) xs.append(x) ys.append(y) return xs, ys axes1 = plt.subplot2grid ((7, 1), (0, 0), rowspan = 2, colspan = 1) axes2 = plt.subplot2grid ((7, 1), (2, 0), rowspan = 2, colspan = 1) axes3 = plt.subplot2grid ((7, 1), (4, 0), rowspan = 2, colspan = 1) x, y = helper()axes1.plot(x, y) x, y = helper()axes2.plot(x, y) x, y = helper()axes3.plot(x, y) |
Выход: 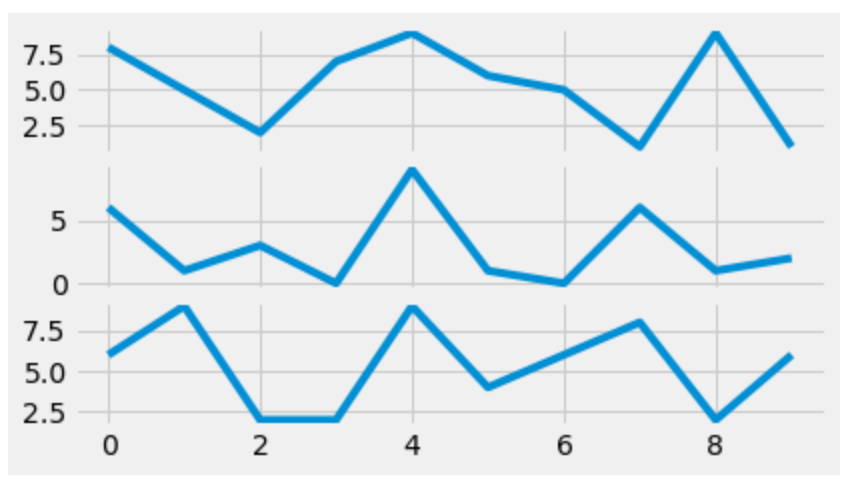
Внимание компьютерщик! Укрепите свои основы с помощью базового курса программирования Python и изучите основы.
Для начала подготовьтесь к собеседованию. Расширьте свои концепции структур данных с помощью курса Python DS. А чтобы начать свое путешествие по машинному обучению, присоединяйтесь к курсу Машинное обучение - базовый уровень.