Matplotlib.axes.Axes.triplot () в Python
Matplotlib - это библиотека на Python, которая является численно-математическим расширением библиотеки NumPy. Класс Axes содержит большинство элементов фигуры: Axis, Tick, Line2D, Text, Polygon и т. Д. И задает систему координат. А экземпляры Axes поддерживают обратные вызовы через атрибут callbacks.
Функция matplotlib.axes.Axes.triplot ()
The Axes.triplot() function in axes module of matplotlib library is also used to create a unstructured triangular grid as lines and/or markers.
Syntax:
Axes.triplot(ax, *args, **kwargs)Parameters: This method accept the following parameters that are described below:
- x, y: These parameter are the x and y coordinates of the data which is to be plot.
- triangulation: This parameter is a matplotlib.tri.Triangulation object.
- **kwargs: This parameter is Text properties that is used to control the appearance of the labels.
All remaining args and kwargs are the same as for matplotlib.pyplot.plot().
Returns: This returns the list of 2 Line2D containing following:
- The lines plotted for triangles edges.
- The markers plotted for triangles nodes
Below examples illustrate the matplotlib.axes.Axes.triplot() function in matplotlib.axes:
Example-1:
# Implementation of matplotlib functionimport matplotlib.pyplot as pltimport matplotlib.tri as mtriimport numpy as np # Create triangulation.x = np.asarray([0, 1, 2, 3, 0.5, 1.5, 2.5, 1, 2, 1.5])y = np.asarray([0, 0, 0, 0, 1.0, 1.0, 1.0, 2, 2, 3.0])triangles = [[0, 1, 4], [1, 5, 4], [2, 6, 5], [4, 5, 7], [5, 6, 8], [5, 8, 7], [7, 8, 9], [1, 2, 5], [2, 3, 6]] triang = mtri.Triangulation(x, y, triangles)z = np.cos(1.5 * x) * np.cos(1.5 * y) fig, axs = plt.subplots()axs.tricontourf(triang, z)axs.triplot(triang, "go-", color ="white")fig.tight_layout() axs.set_title("matplotlib.axes.Axes.triplot() Example")plt.show() |
Output: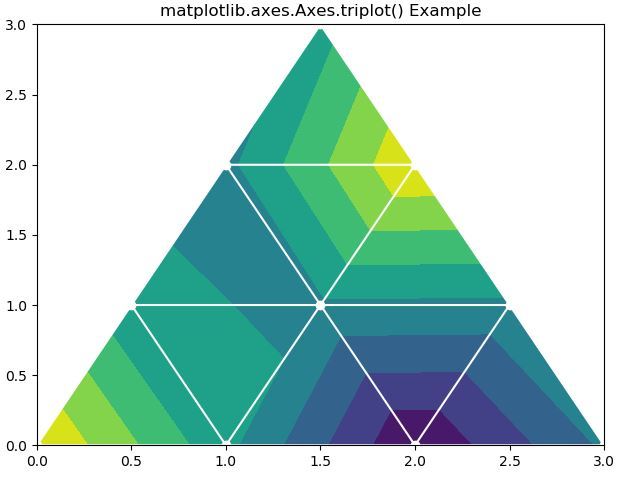
Example-2:
# Implementation of matplotlib functionimport matplotlib.pyplot as pltimport matplotlib.tri as triimport numpy as np n_angles = 24n_radii = 9min_radius = 0.5radii = np.linspace(min_radius, 0.9, n_radii) angles = np.linspace(0, np.pi, n_angles, endpoint = False)angles = np.repeat(angles[..., np.newaxis], n_radii, axis = 1)angles[:, 1::2] += np.pi / n_angles x = (radii * np.cos(angles)).flatten()y = (radii * np.sin(angles)).flatten()triang = tri.Triangulation(x, y) triang.set_mask(np.hypot(x[triang.triangles].mean(axis = 1), y[triang.triangles].mean(axis = 1)) < min_radius) fig1, ax1 = plt.subplots()ax1.set_aspect("equal")ax1.triplot(triang, "go-", lw = 2)ax1.set_title("matplotlib.axes.Axes.triplot() Example")plt.show() |
Output: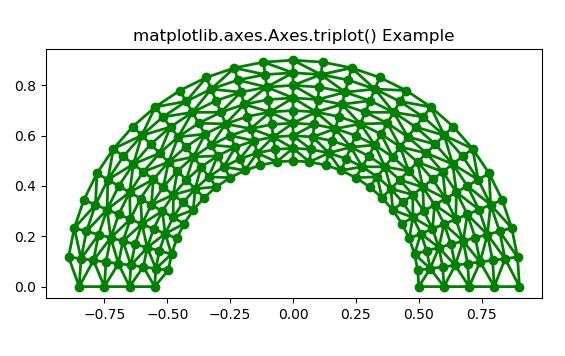
Attention geek! Strengthen your foundations with the Python Programming Foundation Course and learn the basics.
To begin with, your interview preparations Enhance your Data Structures concepts with the Python DS Course. And to begin with your Machine Learning Journey, join the Machine Learning – Basic Level Course