Matplotlib.axes.Axes.specgram () в Python
Matplotlib - это библиотека на Python, которая является численно-математическим расширением библиотеки NumPy. Класс Axes содержит большинство элементов фигуры: Axis, Tick, Line2D, Text, Polygon и т. Д. И задает систему координат. А экземпляры Axes поддерживают обратные вызовы через атрибут callbacks.
Функция matplotlib.axes.Axes.specgram ()
Функция Axes.specgram () в модуле axes библиотеки matplotlib используется для построения спектрограммы.
Syntax: Axes.specgram(self, x, NFFT=None, Fs=None, Fc=None, detrend=None, window=None, noverlap=None, cmap=None, xextent=None, pad_to=None, sides=None, scale_by_freq=None, mode=None, scale=None, vmin=None, vmax=None, *, data=None, **kwargs)
Parameters: This method accept the following parameters that are described below:
- x: This parameter is a sequence of data.
- Fs : This parameter is a scalar. Its default value is 2.
- window: This parameter take a data segment as an argument and return the windowed version of the segment. Its default value is window_hanning()
- sides: This parameter specifies which sides of the spectrum to return. This can have following values : ‘default’, ‘onesided’ and ‘twosided’.
- pad_to : This parameter contains the integer value to which the data segment is padded.
- Fc: This parameter is also contains the integer value to offsets the x extents of the plot to reflect the frequency range. Its default value is 0
- NFFT : This parameter contains the number of data points used in each block for the FFT.
- detrend : This parameter contains the function applied to each segment before fft-ing, designed to remove the mean or linear trend {‘none’, ‘mean’, ‘linear’}.
- scale_by_freq : This parameter is allows for integration over the returned frequency values.
- mode : This parameter is that what sort of spectrum to use {‘default’, ‘psd’, ‘magnitude’, ‘angle’, ‘phase’}.
- noverlap : This parameter is the number of points of overlap between blocks.
- scale : This parameter contains the scaling of the values in the spec {‘default’, ‘linear’, ‘dB’}.
- Fc : This parameter is the center frequency of x.
- camp: This parameter is a matplotlib.colors.Colormap instance.
Returns: This returns the following:
- spectrum :This returns the angle spectrum in radians.
- freqs :This returns the frequencies corresponding to the elements in spectrum.
- t: This returns the times corresponding to midpoints of segments.
- im: This returns the image created by imshow containing the spectrogram.
The resultant is (spectrum, freqs, t, im)
Примеры ниже иллюстрируют функцию matplotlib.axes.Axes.specgram () в matplotlib.axes:
Example-1:
# Implementation of matplotlib functionimport matplotlib.pyplot as pltimport numpy as np dt = 0.005t = np.arange(0.0, 20.0, dt)x = np.sin(np.pi * t) + 1.5 * np.cos(np.pi * t) fig, ax1 = plt.subplots()ax1.specgram(x, Fs = 1)ax1.set_title("matplotlib.axes.Axes.specgram() Example") plt.show() |
Выход: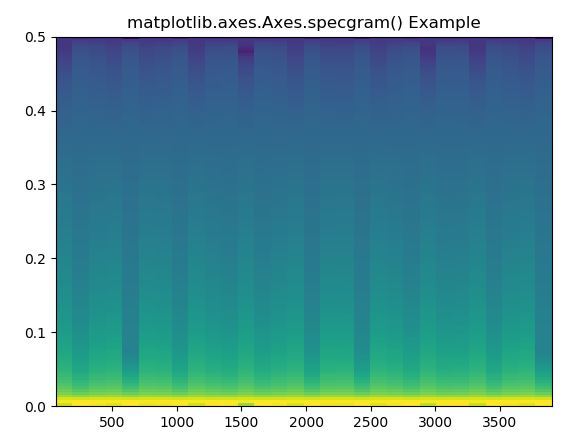
Example-2:
# Implementation of matplotlib functionimport matplotlib.pyplot as pltimport numpy as np np.random.seed(9360801) dt = 0.0005t = np.arange(0.0, 20.0, dt)s1 = np.sin(4 * np.pi * 100 * t)s2 = 1.5 * np.sin(1.5 * np.pi * 400 * t) s2[t <= 10] = s2[12 <= t] = 0 nse = 0.2 * np.random.random(size = len(t)) x = s1 + s2 + nse NFFT = 512 Fs = int(1.0 / dt) fig, ax1 = plt.subplots()ax1.specgram(x, Fs = Fs, cmap = plt.cm.bone)ax1.set_title("matplotlib.axes.Axes.specgram() Example") plt.show() |
Выход: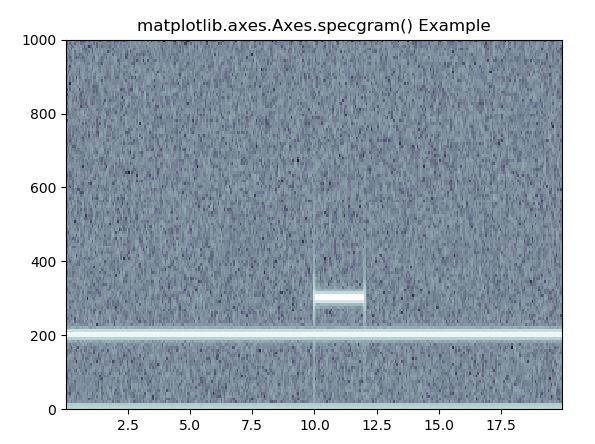
Внимание компьютерщик! Укрепите свои основы с помощью базового курса программирования Python и изучите основы.
Для начала подготовьтесь к собеседованию. Расширьте свои концепции структур данных с помощью курса Python DS. А чтобы начать свое путешествие по машинному обучению, присоединяйтесь к курсу Машинное обучение - базовый уровень.