Matplotlib.axes.Axes.set_adjustable () в Python
Matplotlib - это библиотека на Python, которая является численно-математическим расширением библиотеки NumPy. Класс Axes содержит большинство элементов фигуры: Axis, Tick, Line2D, Text, Polygon и т. Д. И задает систему координат. А экземпляры Axes поддерживают обратные вызовы через атрибут callbacks.
Функция matplotlib.axes.Axes.set_adjustable ()
Функция Axes.set_adjustable () в модуле axes библиотеки matplotlib используется для определения того, какой параметр Axes будет изменять для достижения заданного аспекта.
Syntax: Axes.set_adjustable(self, adjustable, share=False)
Parameters: This method accepts the following parameters.
- adjustable : This defines which parameter will be adjusted to meet the required aspect.
- share: This parameter is used to apply the settings to all shared Axes.
Return value: This method does not return any value.
Примеры ниже иллюстрируют функцию matplotlib.axes.Axes.set_adjustable () в matplotlib.axes:
Example 1:
# ImpleIn Reviewtation of matplotlib function import matplotlib.pyplot as plt fig, (ax1, ax2) = plt.subplots(1, 2)ax1.set_xscale("log")ax1.set_yscale("log")ax1.set_xlim(1e1, 1e3)ax1.set_ylim(1e2, 1e3)ax1.set_aspect(1)ax1.set_title("adjustable = box") ax2.set_xscale("log")ax2.set_yscale("log")ax2.set_adjustable("datalim")ax2.plot([1, 113, 10], [1, 119, 100], "o-")ax2.set_xlim(1e-1, 1e2)ax2.set_ylim(1e-1, 1e3)ax2.set_aspect(1)ax2.set_title("adjustable = datalim") fig.suptitle("matplotlib.axes.Axes.set_adjustable() function Example
", fontweight ="bold")fig.canvas.draw()plt.show() |
Выход: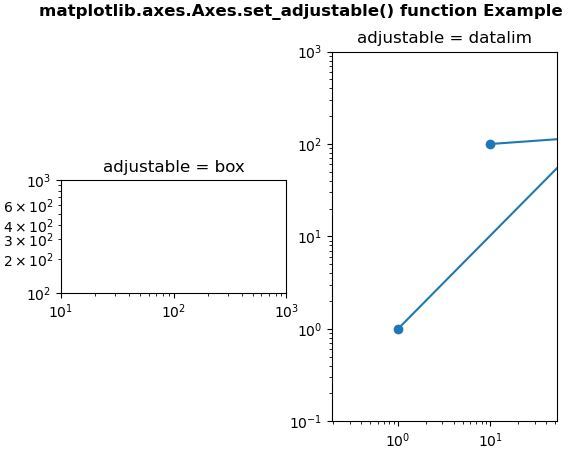
Example 2:
# ImpleIn Reviewtation of matplotlib function import matplotlib.pyplot as pltimport matplotlib.tri as triimport numpy as np n_angles = 40n_radii = 10min_radius = 2radii = np.linspace(min_radius, 0.95, n_radii) angles = np.linspace(0, 4 * np.pi, n_angles, endpoint = False)angles = np.repeat(angles[..., np.newaxis], n_radii, axis = 1)angles[:, 1::2] += np.pi / n_angles x = (radii * np.cos(angles)).flatten()y = (radii * np.sin(angles)).flatten() triang = tri.Triangulation(x, y) triang.set_mask(np.hypot(x[triang.triangles].mean(axis = 1), y[triang.triangles].mean(axis = 1)) < min_radius)fig, (ax, ax1) = plt.subplots(1, 2) ax.triplot(triang, "bo-", lw = 1, color = "green")ax.set_aspect("equal")ax.set_title("adjustable = box") ax1.set_aspect("equal")ax1.set_adjustable("datalim")ax1.triplot(triang, "bo-", lw = 1, color = "green")ax1.set_title("adjustable = datalim") fig.suptitle("matplotlib.axes.Axes.set_adjustable() function Example
", fontweight ="bold")fig.canvas.draw()plt.show() |
Выход:
Внимание компьютерщик! Укрепите свои основы с помощью базового курса программирования Python и изучите основы.
Для начала подготовьтесь к собеседованию. Расширьте свои концепции структур данных с помощью курса Python DS. А чтобы начать свое путешествие по машинному обучению, присоединяйтесь к курсу Машинное обучение - базовый уровень.