Matplotlib.axes.Axes.pcolor () в Python
Matplotlib - это библиотека на Python, которая является численно-математическим расширением библиотеки NumPy. Класс Axes содержит большинство элементов фигуры: Axis, Tick, Line2D, Text, Polygon и т. Д. И задает систему координат. А экземпляры Axes поддерживают обратные вызовы через атрибут callbacks.
Функция matplotlib.axes.Axes.pcolor ()
Функция Axes.pcolor () в модуле axes библиотеки matplotlib также используется для создания псевдоцветного графика с нерегулярной прямоугольной сеткой.
Syntax: Axes.pcolor(self, *args, alpha=None, norm=None, cmap=None, vmin=None, vmax=None, data=None, **kwargs)
pcolor([X, Y, ] C, **kwargs)Parameters: This method accept the following parameters that are described below:
- C : This parameter contains the values in 2D array which are to be color-mapped.
- X, Y: These parameter are the coordinates of the quadrilateral corners.
- cmap : This parameter is a colormap instance or registered colormap name.
- norm : This parameter is the Normalize instance scales the data values to the canonical colormap range [0, 1] for mapping to colors
- vmin, vmax : These parameter are optional in nature and they are colorbar range.
- edgecolors : This parameter is a ccolor of the edges. {‘none’, None, ‘face’, color, color sequence}
- alpha : This parameter is a intensity of the color.
- snap : This parameter is used to snap the mesh to pixel boundaries.
Returns: This returns the collection.
Примеры ниже иллюстрируют функцию matplotlib.axes.Axes.pcolor () в matplotlib.axes:
Example-1:
# Implementation of matplotlib functionimport matplotlib.pyplot as pltimport numpy as npfrom matplotlib.colors import LogNorm Z = np.random.rand(6, 30) fig, ax0 = plt.subplots() ax0.pcolor(Z) ax0.set_title("matplotlib.axes.Axes.pcolor() Examples")plt.show() |
Выход: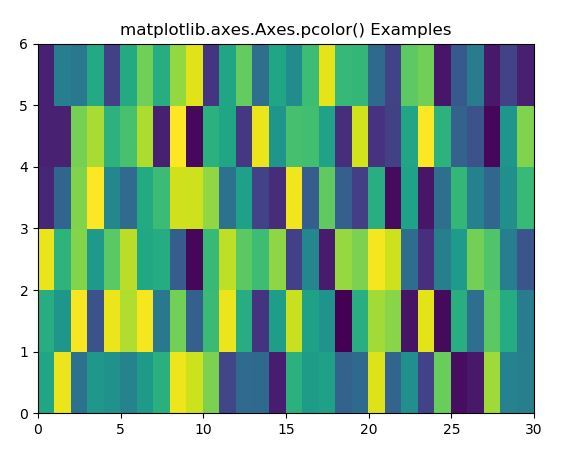
Example-2:
# Implementation of matplotlib functionimport matplotlib.pyplot as pltimport numpy as npfrom matplotlib.colors import LogNorm Z = np.random.rand(16, 30) fig, (ax0, ax1) = plt.subplots(2, 1) c = ax0.pcolor(Z) c = ax1.pcolor(Z, edgecolors ="k", linewidths = 1)ax1.set_title("2.Example with edges") ax0.set_title("matplotlib.axes.Axes.pcolor() Examples
1.Example with no edges")plt.show() |
Выход: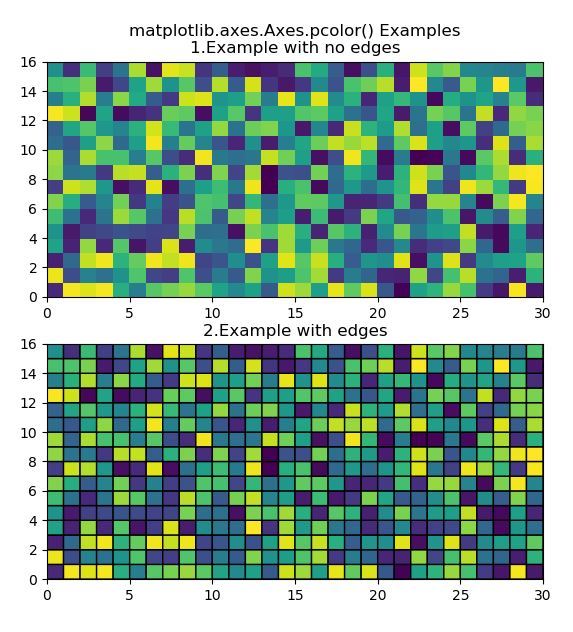
Внимание компьютерщик! Укрепите свои основы с помощью базового курса программирования Python и изучите основы.
Для начала подготовьтесь к собеседованию. Расширьте свои концепции структур данных с помощью курса Python DS. А чтобы начать свое путешествие по машинному обучению, присоединяйтесь к курсу Машинное обучение - базовый уровень.