Matplotlib.axes.Axes.indicate_inset_zoom () в Python
Matplotlib - это библиотека на Python, которая является численно-математическим расширением библиотеки NumPy. Класс Axes содержит большинство элементов фигуры: Axis, Tick, Line2D, Text, Polygon и т. Д. И задает систему координат. А экземпляры Axes поддерживают обратные вызовы через атрибут callbacks.
matplotlib.axes.Axes.indicate_inset_zoom () Функция
Функция Axes.indicate_inset () в модуле осей библиотеки matplotlib также используется для добавления индикатора вставки к осям.
Syntax: Axes.indicate_inset(self, bounds, inset_ax=None, *, transform=None, facecolor=’none’, edgecolor=’0.5′, alpha=0.5, zorder=4.99, **kwargs)
Parameters: This method accept the following parameters that are described below:
- inset_ax: This parameter is an optional inset axes to draw connecting lines to.
- **kwargs: Other kwargs are passed on to Axes.inset_rectangle.
Returns: This method returns the the following:
- rectangle_patch : This return the indicator frame.
- connector_lines: This return the four connector lines connecting to (lower_left, upper_left, lower_right upper_right) corners of inset_ax.
Примечание: эта функция работает в Matplotlib версии> = 3.0.
Примеры ниже иллюстрируют функцию matplotlib.axes.Axes.indicate_inset_zoom () в matplotlib.axes:
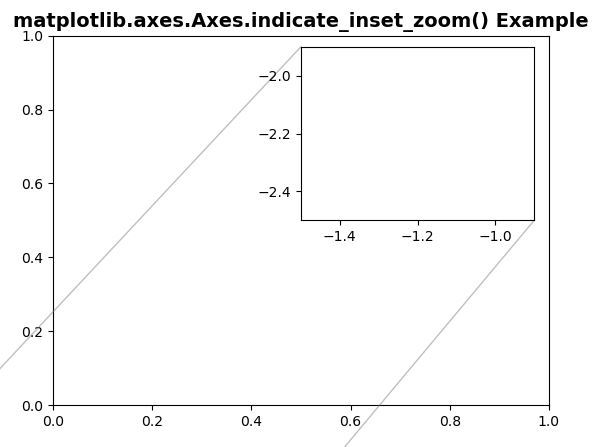
Example 1:
# Implementation of matplotlib functionimport matplotlib.pyplot as pltimport numpy as npfig, ax = plt.subplots() Z2 = np.zeros([150, 150], dtype ="g") axins = ax.inset_axes([0.5, 0.5, 0.47, 0.47])x1, x2, y1, y2 = -1.5, -0.9, -2.5, -1.9axins.set_xlim(x1, x2)axins.set_ylim(y1, y2) ax.indicate_inset_zoom(axins) ax.set_title("matplotlib.axes.Axes.indicate_inset_zoom() Example", fontsize = 14, fontweight ="bold")plt.show() |
Выход:
Example 2:
# Implementation of matplotlib functionimport matplotlib.pyplot as pltimport numpy as np def geeks(): from matplotlib.cbook import get_sample_data import numpy as np f = get_sample_data("axes_grid / bivariate_normal.npy", asfileobj = False) z = np.load(f) return z, (-3, 4, -4, 3) fig, ax = plt.subplots() X, extent = geeks()Z2 = np.zeros([150, 150], dtype ="g")ny, nx = X.shapeZ2[30:30 + ny, 30:30 + nx] = X ax.imshow(Z2, extent = extent, interpolation ="nearest", origin ="lower", cmap ="YlGn") axins = ax.inset_axes([0.5, 0.5, 0.47, 0.47])axins.imshow(Z2, extent = extent, interpolation ="nearest", origin ="lower", cmap ="BuGn")x1, x2, y1, y2 = -1.5, -0.9, -2.5, -1.9axins.set_xlim(x1, x2)axins.set_ylim(y1, y2) ax.indicate_inset_zoom(axins) ax.set_title("matplotlib.axes.Axes.indicate_inset_zoom() Example", fontsize = 14, fontweight ="bold")plt.show() |
Выход: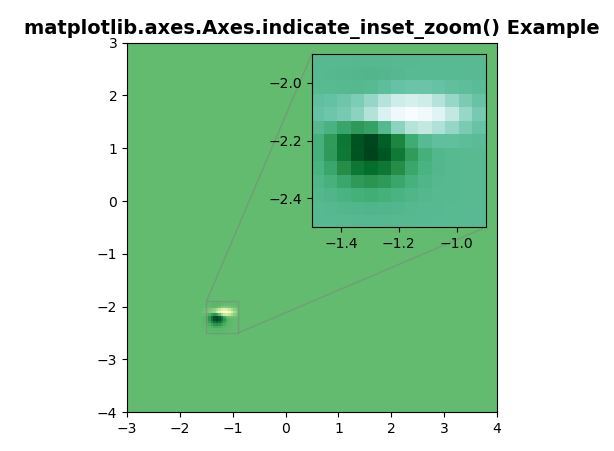
Внимание компьютерщик! Укрепите свои основы с помощью базового курса программирования Python и изучите основы.
Для начала подготовьтесь к собеседованию. Расширьте свои концепции структур данных с помощью курса Python DS. А чтобы начать свое путешествие по машинному обучению, присоединяйтесь к курсу Машинное обучение - базовый уровень.