Matplotlib.axes.Axes.get_ylabel () в Python
Matplotlib - это библиотека на Python, которая является численно-математическим расширением библиотеки NumPy. Класс Axes содержит большинство элементов фигуры: Axis, Tick, Line2D, Text, Polygon и т. Д. И задает систему координат. А экземпляры Axes поддерживают обратные вызовы через атрибут callbacks.
Функция matplotlib.axes.Axes.get_ylabel ()
Функция Axes.get_ylabel () в модуле axes библиотеки matplotlib используется для получения текстовой строки ylabel.
Syntax: Axes.get_ylabel(self)
Parameters: This method does not accepts any parameters.
Return: This function return the ylabel text string.
Примеры ниже иллюстрируют функцию matplotlib.axes.Axes.get_ylabel () в matplotlib.axes:
Example 1:
import matplotlib.pyplot as pltimport numpy as np t = np.arange(0.01, 5.0, 0.01)s = np.exp(-t) fig, ax = plt.subplots() ax.plot(t, s)ax.set_ylim(1, 0)ax.set_ylabel("Display Y-axis Label", fontweight ="bold")ax.grid(True) w = ax.get_ylabel()ax.set_ylabel("")ax.text(1.5, 0.58, "Previously assigned Y-Label :
"+str(w), fontsize = 12)fig.suptitle("matplotlib.axes.Axes.get_ylabel() function Example
", fontweight ="bold")plt.show() |
Выход: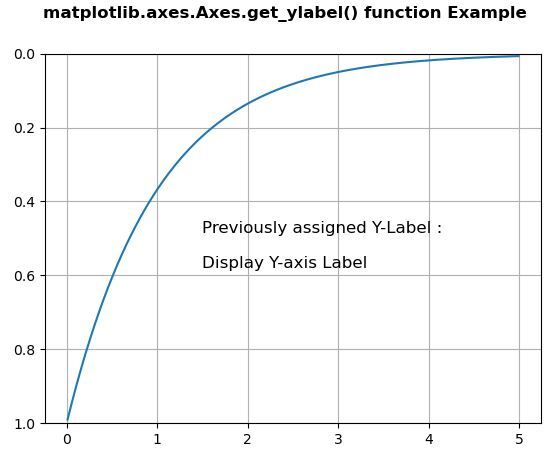
Example 2:
# Implementation of matplotlib functionimport numpy as npimport matplotlib.pyplot as pltimport matplotlib.cbook as cbook with cbook.get_sample_data("goog.npz") as datafile: price_data = np.load(datafile)["price_data"].view(np.recarray)price_data = price_data[-250:] # get the most recent 250 trading days delta1 = np.diff(price_data.adj_close) / price_data.adj_close[:-1] volume = (25 * price_data.volume[:-2] / price_data.volume[0])**(2.2)close = (0.03 * price_data.close[:-2] / 0.03 * price_data.open[:-2])**2 fig, ax = plt.subplots()ax.scatter(delta1[:-1], delta1[1:], c = close, s = volume, alpha = 0.5) ax.set_ylabel(r"Y-axis contains $Delta_{i + 1}$ values", fontweight ="bold")ax.grid(True) w = ax.get_ylabel()ax.set_ylabel("")ax.set_xlabel(w)ax.text(-0.1, 0.1, "Previously assigned Y-Label is now Assignedto X-Label", fontsize = 12, fontweight ="bold") fig.suptitle("matplotlib.axes.Axes.get_ylabel() function Example
", fontweight ="bold")plt.show() |
Выход: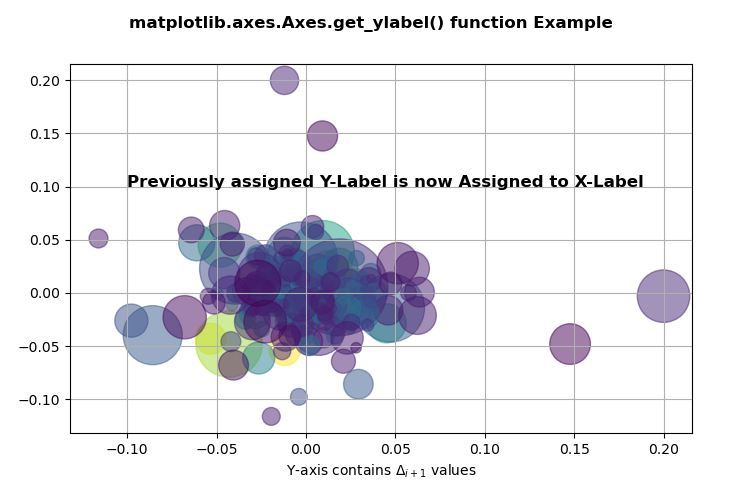
Внимание компьютерщик! Укрепите свои основы с помощью базового курса программирования Python и изучите основы.
Для начала подготовьтесь к собеседованию. Расширьте свои концепции структур данных с помощью курса Python DS. А чтобы начать свое путешествие по машинному обучению, присоединяйтесь к курсу Машинное обучение - базовый уровень.