Matplotlib.axes.Axes.acorr () в Python
Matplotlib - это библиотека на Python, которая является численно-математическим расширением библиотеки NumPy. Класс Axes содержит большинство элементов фигуры: Axis, Tick, Line2D, Text, Polygon и т. Д. И задает систему координат. А экземпляры Axes поддерживают обратные вызовы через атрибут callbacks.
Функция matplotlib.axes.Axes.acorr ()
Функция Axes.acorr () в модуле axes библиотеки matplotlib используется для построения автокорреляции x.
Syntax: Axes.acorr(self, x, *, data=None, **kwargs)
Parameters: This method accept the following parameters that are described below:
- x: This parameter is a sequence of scalar.
- detrend: This parameter is an optional parameter. Its default value is mlab.detrend_none
- normed: This parameter is also an optional parameter and contains the bool value. Its default value is True
- usevlines: This parameter is also an optional parameter and contains the bool value. Its default value is True
- maxlags: This parameter is also an optional parameter and contains the integer value. Its default value is 10
- linestyle: This parameter is also an optional parameter and used for plotting the data points, only when usevlines is False.
- marker: This parameter is also an optional parameter and contains the string. Its default value is ‘o’
Returns: This method returns the following:
- lags:This method returns the lag vector
- c:This method returns the auto correlation vector.
- line : Added LineCollection if usevlines is True, otherwise add Line2D.
- b: This method returns the horizontal line at 0 if usevlines is True, otherwise None.
The resultant is (lags, c, line, b).
Примеры ниже иллюстрируют функцию matplotlib.axes.Axes.acorr () в matplotlib.axes:
Example 1:
# Implementation of matplotlib function import matplotlib.pyplot as pltimport numpy as np # Time series datageeks = np.array([24.40, 110.25, 20.05, 22.00, 61.90, 7.80, 15.00, 22.80, 34.90, 57.30]) # Plot autocorrelationfig, ax = plt.subplots()ax.acorr(geeks, maxlags = 9) # Add labels to autocorrelation# plotax.xlabel("X-axis")ax.set_ylabel("Y-axis") ax.set_title("matplotlib.axes.Axes.acorr() Example") plt.show() |
Выход: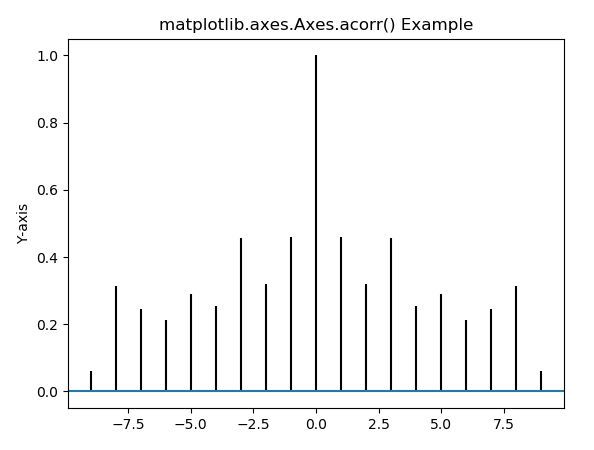
Example 2:
# Implementation of matplotlib functionimport matplotlib.pyplot as pltimport numpy as np # Fixing random state for reproducibilitynp.random.seed(10**7)geeks = np.random.randn(100) fig, ax = plt.subplots()ax.acorr(geeks, usevlines = True, normed = True, maxlags = 80, lw = 3)ax.grid(True) ax.set_title("matplotlib.axes.Axes.acorr() Example") plt.show() |
Выход: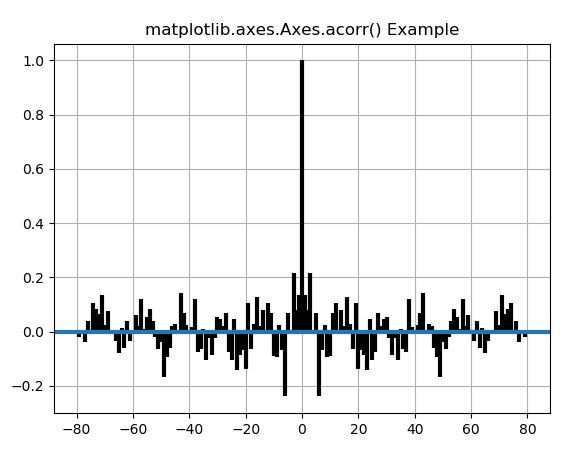
Внимание компьютерщик! Укрепите свои основы с помощью базового курса программирования Python и изучите основы.
Для начала подготовьтесь к собеседованию. Расширьте свои концепции структур данных с помощью курса Python DS. А чтобы начать свое путешествие по машинному обучению, присоединяйтесь к курсу Машинное обучение - базовый уровень.