Как построить угол в Python с помощью Matplotlib?
В этой статье мы узнаем, как построить угол в Python. Как мы знаем, чтобы нарисовать угол, должны быть две пересекающиеся линии, чтобы можно было создать угол между этими двумя линиями в точке пересечения. Здесь мы наносим угол на две пересекающиеся прямые линии. Итак, давайте сначала обсудим некоторые концепции:
- NumPy - это универсальный пакет для обработки массивов. Он предоставляет высокопроизводительный объект многомерного массива и инструменты для работы с этими массивами.
- Matplotlib - потрясающая библиотека визуализации на Python для 2D-графиков массивов. Matplotlib - это многоплатформенная библиотека визуализации данных, построенная на массивах NumPy и предназначенная для работы с более широким стеком SciPy. Он был представлен Джоном Хантером в 2002 году.
В этом файле matplotlib используется для графического построения угла, и он лучше всего подходит для Numpy, тогда как NumPy - это числовой Python, который используется для выполнения расширенной математики .
Необходимые шаги
- Постройте две пересекающиеся линии.
- Найдите точку пересечения, отмеченную цветом.
- Постройте круг таким образом, чтобы точка пересечения двух линий совпадала с центром круга.
- Отметьте это как точку, где круг будет пересекаться с прямыми линиями, и нанесите эти две точки, где мы найдем угол между ними.
- Рассчитайте угол и нанесите его на график.
Пошаговая реализация
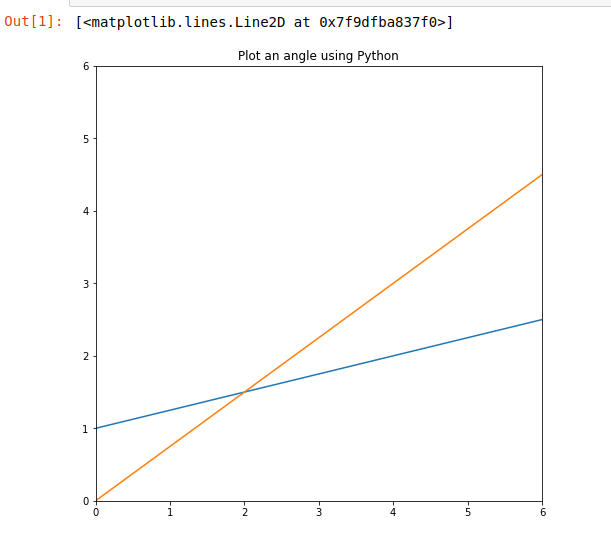
1. Постройте две пересекающиеся линии.
- Здесь первые две строки кода показывают, что matplotlib и NumPy Framework Python импортированы, откуда мы будем использовать встроенные функции в дальнейшем коде.
- После этого снимаются наклон и пересечение для построения двух прямых линий. После этого line-space (l) возвращает числовые пробелы равномерно по отношению к интервалу.
- После этого plt.figure () используется для создания области, в которой мы наносим угол, и его размер указывается в коде.
- После этого, чтобы построить прямые линии, мы должны определить ось. Здесь: ось X: 0-6 и ось Y: 0-6
- Заголовок дается окну рисунка с помощью plt.title ().
After that two lines are plotted as shown in the output below:
Python3
# import packagesimport matplotlib.pyplot as pltimport numpy as np# slope and interceptsa1, b1 = (1/4), 1.0a2, b2 = (3/4), 0.0# The numpy.linspace() function returns# number spaces evenly w.r.t intervall = np.linspace(-6, 6, 100)# use to create new figureplt.figure(figsize=(8, 8))# plottingplt.xlim(0, 6)plt.ylim(0, 6)plt.title("Plot an angle using Python")plt.plot(l, l*a1+b1)plt.plot(l, l*a2+b2)plt.show() |
Выход :
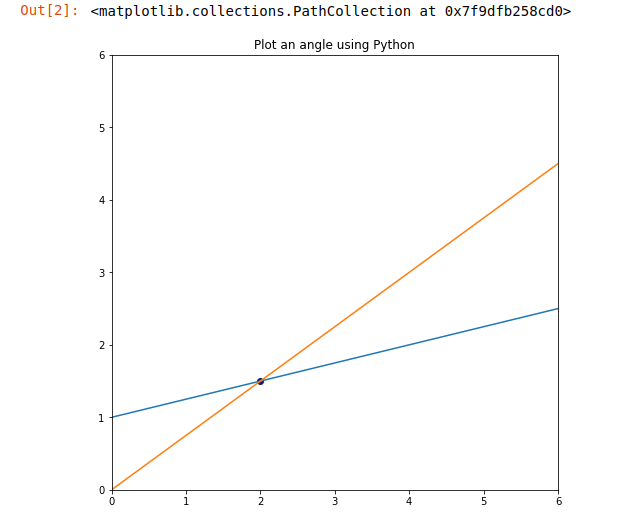
2. Найдите точку пересечения и отметьте ее цветом.
Здесь x0, y0 обозначают точку пересечения двух прямых. Построенные две Прямые линии записываются как:
 у1 = а1 * х + b1
у2 = а2 * х + Ь2.
Решая вышеуказанные уравнения, мы получаем,
 х0 = (b2-b1) / (a1-a2) - (i)
y0 = a1 * x0 + b1 - (ii)
From above equation (i) and (ii) we will get the point of intersection of Two Straight lines and after that, the color =’midnightblue’ is assigned to the point of intersection using plot.scatter() function.
Python3
# import packagesimport matplotlib.pyplot as pltimport numpy as np# slope and interceptsa1, b1 = (1/4), 1.0a2, b2 = (3/4), 0.0# The numpy.linspace() function returns# number spaces evenly w.r.t intervall = np.linspace(-6, 6, 100)# use to create new figureplt.figure(figsize=(8, 8))# plottingplt.xlim(0, 6)plt.ylim(0, 6)plt.title("Plot an angle using Python")plt.plot(l, l*a1+b1)plt.plot(l, l*a2+b2)# intersection pointx0 = (b2-b1)/(a1-a2)y0 = a1*x0 + b1plt.scatter(x0, y0, color="midnightblue") |
Выход:
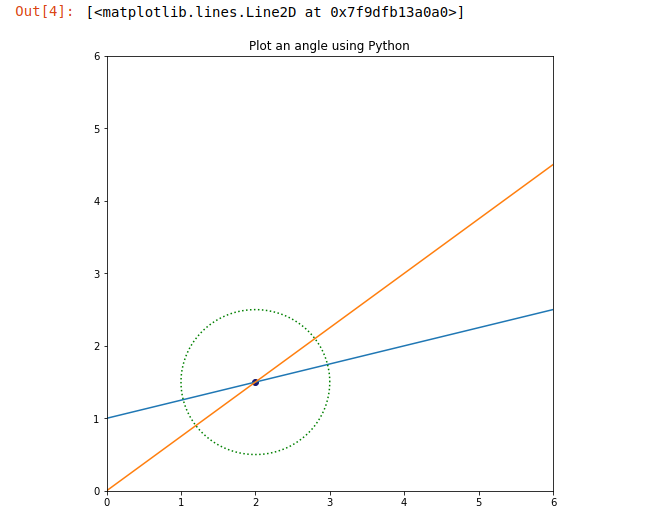
3. Постройте окружность так, чтобы точка пересечения двух линий совпадала с центром окружности.
Здесь мы строим круг, используя параметрическое уравнение круга. Параметрическое уравнение круга:
 x1 = r * cos (тета)
х2 = г * грех (тета)
Если мы хотим, чтобы круг не находился в начале координат, мы используем:
 х1 = г * соз (тета) + ч
х2 = г * грех (тета) + к
Here h and k are the coordinates of the center of the circle. So we use this above equation where h =x0 and k =y0 as shown. Also, here we provide the color to the circle ” blue” and its style is marked as “dotted”.
Python3
# import packagesimport matplotlib.pyplot as pltimport numpy as np# slope and interceptsa1, b1 = (1/4), 1.0a2, b2 = (3/4), 0.0# The numpy.linspace() function returns# number spaces evenly w.r.t intervall = np.linspace(-6, 6, 100)# use to create new figureplt.figure(figsize=(8, 8))# plottingplt.xlim(0, 6)plt.ylim(0, 6)plt.title("Plot an angle using Python")plt.plot(l, l*a1+b1)plt.plot(l, l*a2+b2)# intersection pointx0 = (b2-b1)/(a1-a2)y0 = a1*x0 + b1plt.scatter(x0, y0, color="midnightblue")# circle for angletheta = np.linspace(0, 2*np.pi, 100)r = 1.0x1 = r * np.cos(theta) + x0x2 = r * np.sin(theta) + y0plt.plot(x1, x2, color="green", linestyle="dotted") |
Выход:
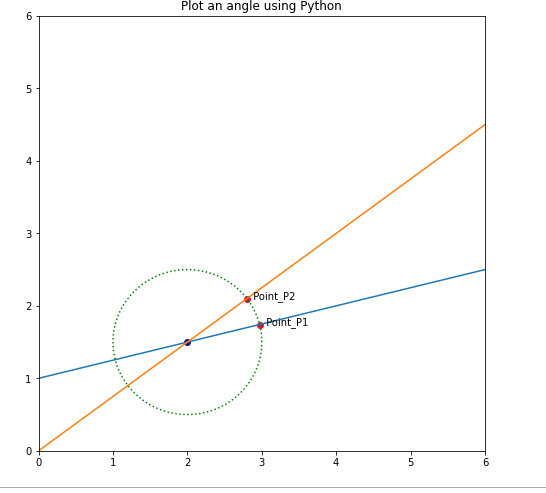
4. Отметьте это как точку, где круг будет пересекаться с прямыми линиями, и нанесите эти две точки, где мы найдем угол между ними.
Now, let’s find the points where the circle is intersecting the two straight lines. Read the comments below and understand how to mark points. After that color i.e. “crimson” color is provided where the circle will intersect two straight lines. After that names are provided to the points as Point_P1, Point_P2 where we find the angle between them and marked it as black colored as shown in the output.
Python3
# import packagesimport matplotlib.pyplot as pltimport numpy as np# slope and interceptsa1, b1 = (1/4), 1.0a2, b2 = (3/4), 0.0# The numpy.linspace() function returns# number spaces evenly w.r.t intervall = np.linspace(-6, 6, 100)# use to create new figureplt.figure(figsize=(8, 8))# plottingplt.xlim(0, 6)plt.ylim(0, 6)plt.title("Plot an angle using Python")plt.plot(l, l*a1+b1)plt.plot(l, l*a2+b2)# intersection pointx0 = (b2-b1)/(a1-a2)y0 = a1*x0 + b1plt.scatter(x0, y0, color="midnightblue")# circle for angletheta = np.linspace(0, 2*np.pi, 100)r = 1.0x1 = r * np.cos(theta) + x0x2 = r * np.sin(theta) + y0plt.plot(x1, x2, color="green", linestyle="dotted")# intersection pointsx_points = []y_points = []# Code for Intersecting points of circle with Straight Linesdef intersection_points(slope, intercept, x0, y0, radius): a = 1 + slope**2 b = -2.0*x0 + 2*slope*(intercept - y0) c = x0**2 + (intercept-y0)**2 - radius**2 # solving the quadratic equation: delta = b**2 - 4.0*a*c # b^2 - 4ac x1 = (-b + np.sqrt(delta)) / (2.0 * a) x2 = (-b - np.sqrt(delta)) / (2.0 * a) x_points.append(x1) x_points.append(x2) y1 = slope*x1 + intercept y2 = slope*x2 + intercept y_points.append(y1) y_points.append(y2) return None# Finding the intersection points for line1 with circleintersection_points(a1, b1, x0, y0, r)# Finding the intersection points for line1 with circleintersection_points(a2, b2, x0, y0, r)# Here we plot Two points in order to find angle between themplt.scatter(x_points[0], y_points[0], color="crimson")plt.scatter(x_points[2], y_points[2], color="crimson")# Naming the points.plt.text(x_points[0], y_points[0], " Point_P1", color="black")plt.text(x_points[2], y_points[2], " Point_P2", color="black") |
Выход:
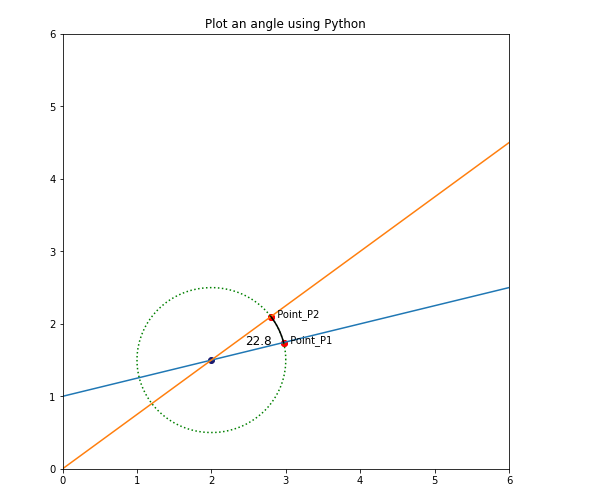
5. Вычислить угол и построить угол.
In the below code the angle between to points Point_P1 and Point_P2 is calculated and finally, it is plotted as shown in the output.
Python3
# import packagesimport matplotlib.pyplot as pltimport numpy as np# slope and interceptsa1, b1 = (1/4), 1.0a2, b2 = (3/4), 0.0# The numpy.linspace() function returns# number spaces evenly w.r.t intervall = np.linspace(-6, 6, 100)# use to create new figureplt.figure(figsize=(8, 8))# plottingplt.xlim(0, 6)plt.ylim(0, 6)plt.title("Plot an angle using Python")plt.plot(l, l*a1+b1)plt.plot(l, l*a2+b2)# intersection pointx0 = (b2-b1)/(a1-a2)y0 = a1*x0 + b1plt.scatter(x0, y0, color="midnightblue")# circle for angletheta = np.linspace(0, 2*np.pi, 100)r = 1.0x1 = r * np.cos(theta) + x0x2 = r * np.sin(theta) + y0plt.plot(x1, x2, color="green", linestyle="dotted")# intersection pointsx_points = []y_points = []# Code for Intersecting points of circle with Straight Linesdef intersection_points(slope, intercept, x0, y0, radius): a = 1 + slope**2 b = -2.0*x0 + 2*slope*(intercept - y0) c = x0**2 + (intercept-y0)**2 - radius**2 # solving the quadratic equation: delta = b**2 - 4.0*a*c # b^2 - 4ac x1 = (-b + np.sqrt(delta)) / (2.0 * a) x2 = (-b - np.sqrt(delta)) / (2.0 * a) x_points.append(x1) x_points.append(x2) y1 = slope*x1 + intercept y2 = slope*x2 + intercept y_points.append(y1) y_points.append(y2) return None# Finding the intersection points for line1 with circleintersection_points(a1, b1, x0, y0, r)# Finding the intersection points for line1 with circleintersection_points(a2, b2, x0, y0, r)# Here we plot Two ponts in order to find angle between themplt.scatter(x_points[0], y_points[0], color="crimson")plt.scatter(x_points[2], y_points[2], color="crimson")# Naming the points.plt.text(x_points[0], y_points[0], " Point_P1", color="black")plt.text(x_points[2], y_points[2], " Point_P2", color="black")# plot angle valuedef get_angle(x, y, x0, y0, radius): base = x - x0 hypotenuse = radius # calculating the angle for a intersection point # which is equal to the cosine inverse of (base / hypotenuse) theta = np.arccos(base / hypotenuse) if y-y0 < 0: theta = 2*np.pi - theta print("theta=", theta, ",theta in degree=", np.rad2deg(theta), "
") return thetatheta_list = []for i in range(len(x_points)): x = x_points[i] y = y_points[i] print("intersection point p{}".format(i)) theta_list.append(get_angle(x, y, x0, y0, r)) # angle for intersection point1 ( here point p1 is taken)p1 = theta_list[0]# angle for intersection point2 ( here point p4 is taken)p2 = theta_list[2]# all the angles between the two intersection pointstheta = np.linspace(p1, p2, 100)# calculate the x and y points for# each angle between the two intersection pointsx1 = r * np.cos(theta) + x0x2 = r * np.sin(theta) + y0# plot the angleplt.plot(x1, x2, color="black")# Code to print the angle at the midpoint of the arc.mid_angle = (p1 + p2) / 2.0x_mid_angle = (r-0.5) * np.cos(mid_angle) + x0y_mid_angle = (r-0.5) * np.sin(mid_angle) + y0angle_in_degree = round(np.rad2deg(abs(p1-p2)), 1)plt.text(x_mid_angle, y_mid_angle, angle_in_degree, fontsize=12)# plotting the intersection pointsplt.scatter(x_points[0], y_points[0], color="red")plt.scatter(x_points[2], y_points[2], color="red")plt.show() |
Выход:
Внимание компьютерщик! Укрепите свои основы с помощью базового курса программирования Python и изучите основы.
Для начала подготовьтесь к собеседованию. Расширьте свои концепции структур данных с помощью курса Python DS. А чтобы начать свое путешествие по машинному обучению, присоединяйтесь к курсу Машинное обучение - базовый уровень.