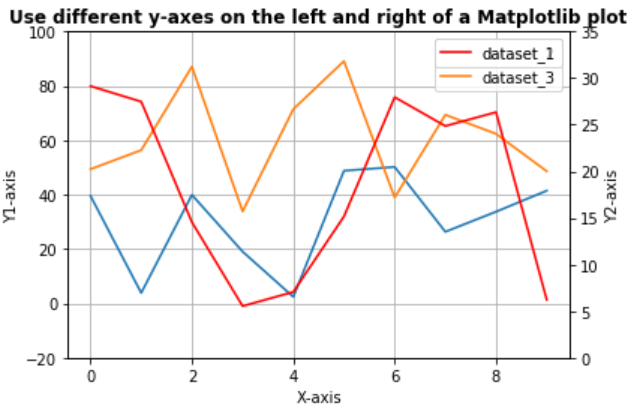
Используйте разные оси Y слева и справа от графика Matplotlib
В этой статье мы собираемся обсудить, как создать оси Y обеих сторон графика Matplotlib.
Иногда для быстрого анализа данных требуется создать один график с двумя переменными данных с разными масштабами. Для этого используются методы двойных осей , то есть двойных осей X или Y. Функция matplotlib.axes.Axes.twinx () в модуле осей библиотеки matplotlib используется для создания двойных осей, разделяющих ось X.
Синтаксис:
matplotlib.axes.Axes.twinx (сам)
Этот метод не принимает никаких параметров, вызывает ошибку, если он указан. Он возвращает объект ax_twin, который указывает, что создан новый экземпляр Axes. Примеры ниже иллюстрируют функцию matplotlib.axes.Axes.twinx () в matplotlib.axes :
Пример 1:
Python3
# import libraries import numpy as np import matplotlib.pyplot as plt # Creating dataset x = np.arange(1.0, 100.0, 0.191) dataset_1 = np.exp(x**0.25) - np.exp(x**0.5) dataset_2 = np.sin(0.4 * np.pi * x**0.5) + np.cos(0.8 * np.pi * x**0.25) # Creating plot with dataset_1fig, ax1 = plt.subplots() color = "tab:red"ax1.set_xlabel("X-axis") ax1.set_ylabel("Y1-axis", color = color) ax1.plot(x, dataset_1, color = color) ax1.tick_params(axis ="y", labelcolor = color) # Adding Twin Axes to plot using dataset_2ax2 = ax1.twinx() color = "tab:green"ax2.set_ylabel("Y2-axis", color = color) ax2.plot(x, dataset_2, color = color) ax2.tick_params(axis ="y", labelcolor = color) # Adding titleplt.title("Use different y-axes on the left and right of a Matplotlib plot", fontweight ="bold") # Show plotplt.show() |
Выход:

Пример 2:
Python3
# import librariesimport numpy as npimport matplotlib.pyplot as pltfrom matplotlib import rcrc( 'mathtext' , default = 'regular' ) # Creating datasetx = np.arange( 10 )dataset_1 = np.random.random( 10 ) * 30dataset_2 = np.random.random( 10 ) * 60dataset_3 = np.random.random( 10 ) * 100 # Creating figurefig = plt.figure() # Plotting dataset_2ax = fig.add_subplot( 111 )ax.plot(x, dataset_2, '-' , label = 'dataset_2' )ax.plot(x, dataset_3, '-' , label = 'dataset_3' ) # Creating Twin axes for dataset_1ax2 = ax.twinx()ax2.plot(x, dataset_1, '-r' , label = 'dataset_1' ) # Adding titleplt.title( 'Use different y-axes on the left and right of a Matplotlib plot' , fontweight = "bold" ) # Adding legendax.legend(loc = 0 )ax2.legend(loc = 0 ) # Sdding gridax.grid() # Adding labelsax.set_xlabel( "X-axis" )ax.set_ylabel(r "Y1-axis" )ax2.set_ylabel(r "Y2-axis" ) # Setting Y limitsax2.set_ylim( 0 , 35 )ax.set_ylim( - 20 , 100 ) # Show plotplt.show() |
Выход:

Внимание компьютерщик! Укрепите свои основы с помощью базового курса программирования Python и изучите основы.
Для начала подготовьтесь к собеседованию. Расширьте свои концепции структур данных с помощью курса Python DS. А чтобы начать свое путешествие по машинному обучению, присоединяйтесь к курсу Машинное обучение - базовый уровень.