Использование Matplotlib с Jupyter Notebook
Jupyter Notebook - это веб-приложение с открытым исходным кодом, которое позволяет создавать и обмениваться документами, содержащими живой код, уравнения, визуализации и повествовательный текст. Области применения: очистка и преобразование данных, численное моделирование, статистическое моделирование, визуализация данных, машинное обучение и многое другое.
Примечание. Для получения дополнительной информации см. Как использовать Jupyter Notebook - полное руководство.
Matplotlib - один из самых популярных пакетов Python, используемых для визуализации данных. Это кроссплатформенная библиотека для создания 2D-графиков из данных в массивах. Для начала вам просто нужно сделать необходимый импорт, подготовить некоторые данные, и вы можете начать построение с помощью функции plot (). re done, не забудьте показать свой график с помощью функции show () .
Matplotlib is written in Python and makes use of NumPy, the numerical mathematics extension of Python.It consists of several plots like : –
- Line
- Bar
- Scatter
- Histrogram
- And many more
Installation
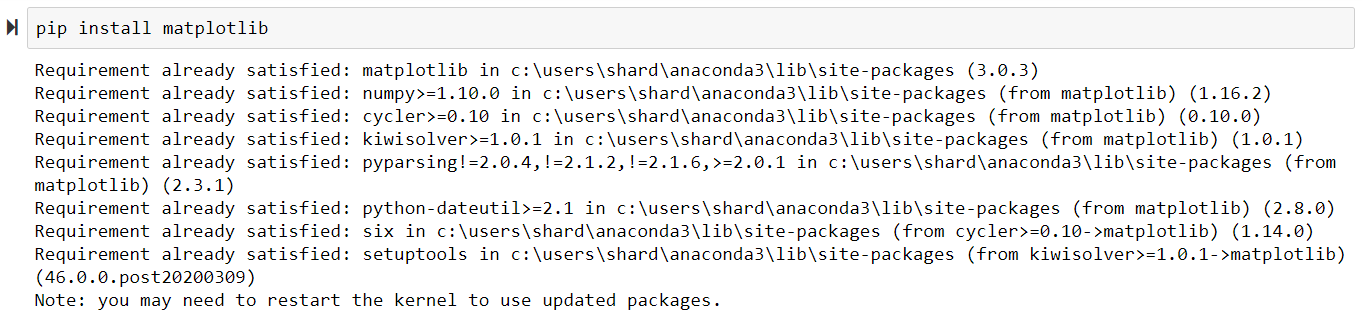
- Install Matplotlib with pip
Matplotlib can also be installed using the Python package manager, pip. To install Matplotlib with pip, open a terminal window and type:pip install matplotlib
- Install Matplotlib with the Anaconda Prompt
Matplotlib can be installed using with the Anaconda Prompt. If the Anaconda Prompt is available on your machine, it can usually be seen in the Windows Start Menu. To install Matplotlib, open the Anaconda Prompt and type:conda install matplotlib

Using Matplotlib with Jupyter Notebook
After the installation is completed. Let’s start using Matplotlib with Jupyter Notebook. We will be plotting various graphs in the Jupyter Notebook using Matplotlib.
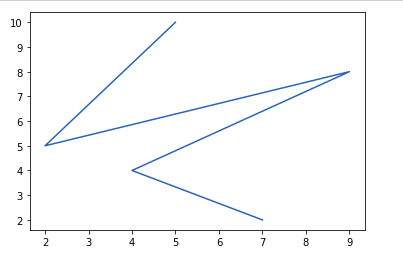
Line Plot
# importing matplotlib module from matplotlib import pyplot as plt # x-axis values x = [5, 2, 9, 4, 7] # Y-axis values y = [10, 5, 8, 4, 2] # Function to plot plt.plot(x, y) # function to show the plot plt.show() |
Output :
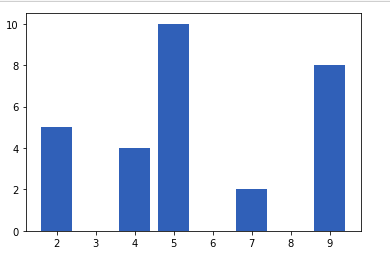
Bar Plot
# importing matplotlib module from matplotlib import pyplot as plt # x-axis values x = [5, 2, 9, 4, 7] # Y-axis values y = [10, 5, 8, 4, 2] # Function to plot plt.bar(x, y) # function to show the plot plt.show() |
Output :
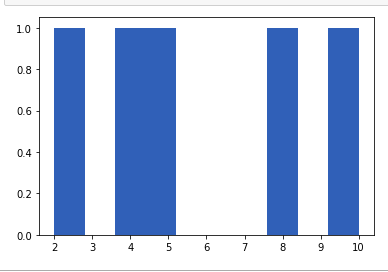
Histogram
# importing matplotlib module from matplotlib import pyplot as plt # Y-axis values y = [10, 5, 8, 4, 2] # Function to plot histogram plt.hist(y) # Function to show the plot plt.show() |
Output :
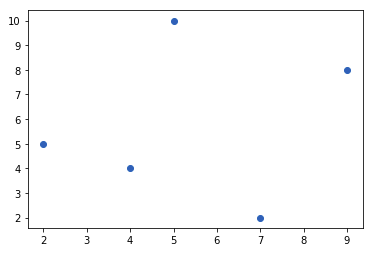
Scatter Plot
# importing matplotlib module from matplotlib import pyplot as plt # x-axis values x = [5, 2, 9, 4, 7] # Y-axis values y = [10, 5, 8, 4, 2] # Function to plot scatter plt.scatter(x, y) # function to show the plot plt.show() |
Output :
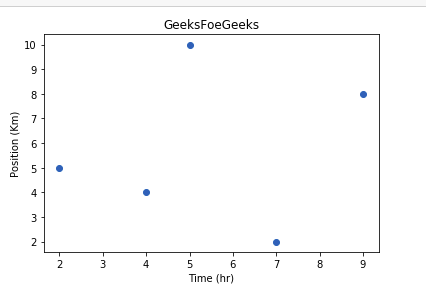
Adding title and Labeling the Axes in the graph
We can add title to the graph by using the following command
matplotlib.pyplot.title("My title")We can label the x-axis and y-axis by using the following functions
matplotlib.pyplot.xlabel("Time (Hr)")

matplotlib.pyplot.ylabel("Position (Km)")
Example :
# importing matplotlib module from matplotlib import pyplot as plt # x-axis values x = [5, 2, 9, 4, 7] # Y-axis values y = [10, 5, 8, 4, 2] # Function to plot plt.scatter(x, y) # Adding Titleplt.title("GeeksFoeGeeks") # Labeling the axesplt.xlabel("Time (hr)")plt.ylabel("Position (Km)") # function to show the plot plt.show() |
Output:
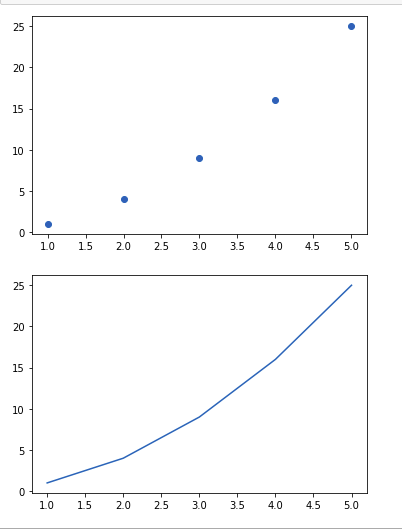
We can also write a program in the same cell for printing Multiple Graphs together.
We can print these graphs vertically one below another by repeating the show() function in the program or we can use a function called subplot() in order to print them horizontally as well.
from matplotlib import pyplot as plt x = [1, 2, 3, 4, 5] y = [1, 4, 9, 16, 25] plt.scatter(x, y) # function to show the plot plt.show() plt.plot(x, y) # function to show the plot plt.show() |
Output
Attention geek! Strengthen your foundations with the Python Programming Foundation Course and learn the basics.
To begin with, your interview preparations Enhance your Data Structures concepts with the Python DS Course. And to begin with your Machine Learning Journey, join the Machine Learning – Basic Level Course