Функция plotly.express.scatter_ternary () в Python
Библиотека Plotly Python может быть очень полезной для визуализации данных и понимания данных просто и легко. Объекты графического представления представляют собой высокоуровневый интерфейс для построения графиков, который прост в использовании.
функция plotly.express.scatter_ternary ()
Этот метод используется для создания тройного графика. Тернарный график используется для изображения отношения трех переменных на равностороннем треугольнике.
Syntax: plotly.express.scatter_ternary(data_frame=None, a=None, b=None, c=None, color=None, symbol=None, size=None, text=None, hover_name=None, hover_data=None, size_max=None, title=None, template=None, width=None, height=None)
Parameters:
data_frame: DataFrame or array-like or dict needs to be passed for column names.
a, b, c: These parameters are either a name of a column in data_frame, or a pandas Series or array_like object. These are used to position marks along the a, b, and c axis in ternary coordinates respectively.
color: This parameters assign color to marks.
symbol: This parameter is used to assign symbols to marks. It is either a name of a column in data_frame, or a pandas Series or array_like object.
size: This parameter is used to assign mark sizes. It is either a name of a column in data_frame, or a pandas Series or array_like object.
hover_name: Values from this column or array_like appear in bold in the hover tooltip.
hover_data: This parameter is used to appear in the hover tooltip or tuples with a bool or formatting string as first element, and list-like data to appear in hover as second element Values from these columns appear as extra data in the hover tooltip.
title: The title of the figure.
width: Set the width of the figure.
height: Set the height of the figure.
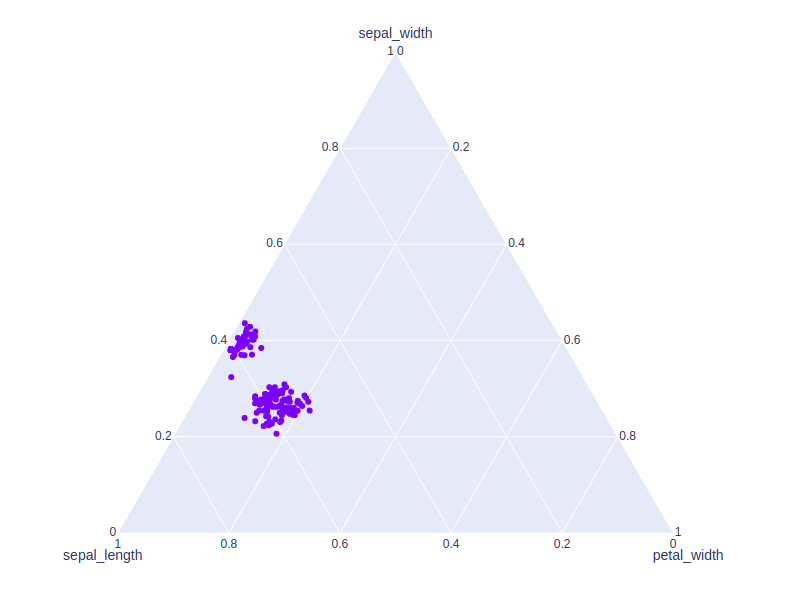
Example 1:
Python3
import plotly.express as px df = px.data.iris() plot = px.scatter_ternary(df, a = "sepal_width", b = "sepal_length", c = "petal_width")plot.show() |
Выход:
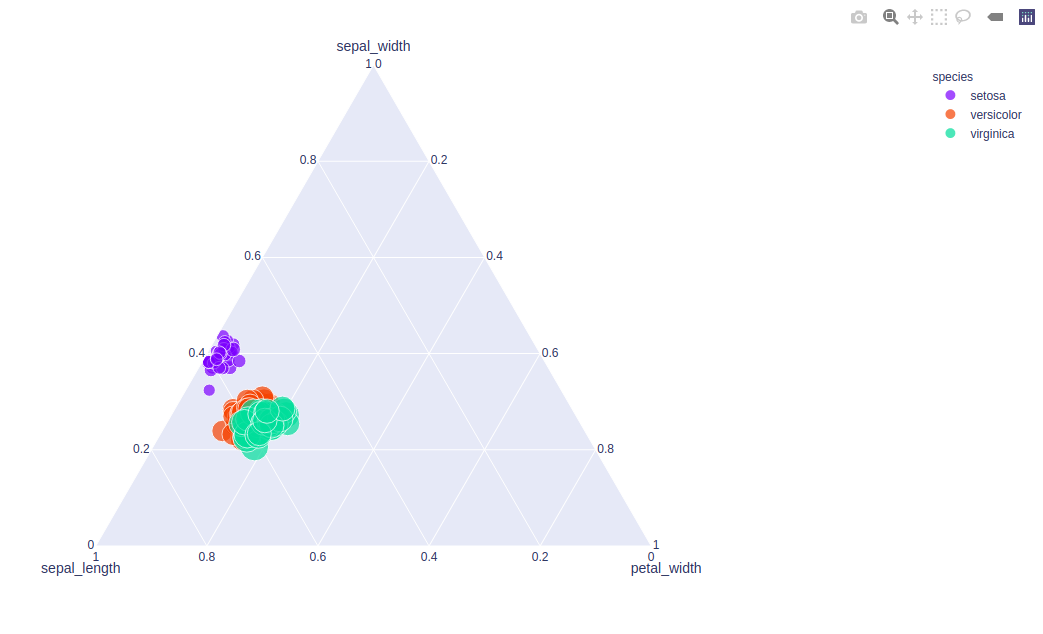
Example 2: Using the size and color arguments
Python3
import plotly.express as px df = px.data.iris() plot = px.scatter_ternary(df, a = "sepal_width", b = "sepal_length", c="petal_width", color = "species", size = "petal_length")plot.show() |
Выход:
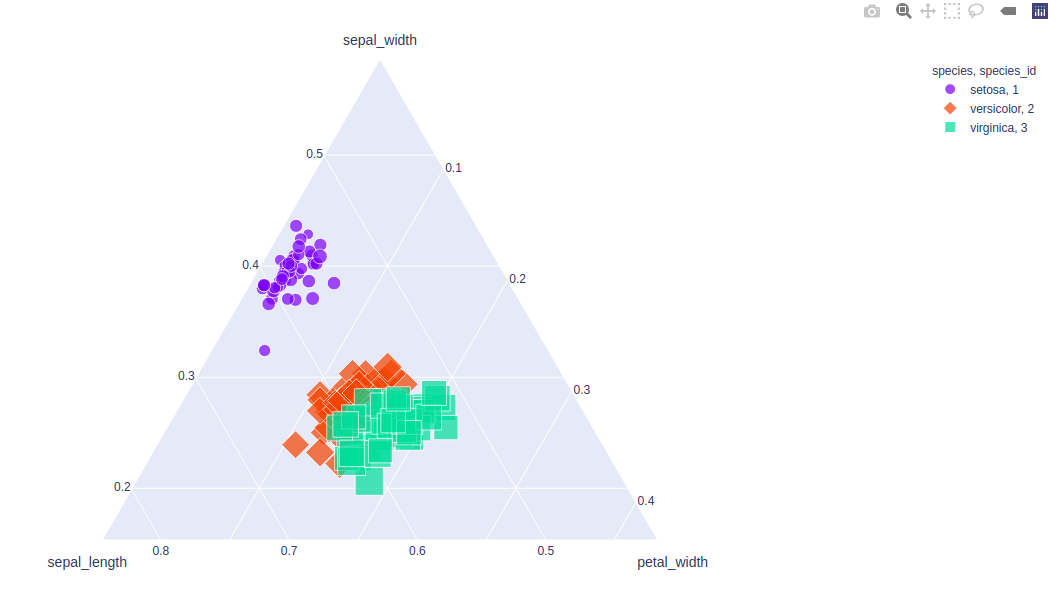
Example 3: Using the symbol parameter
Python3
import plotly.express as px df = px.data.iris() plot = px.scatter_ternary(df, a = "sepal_width", b = "sepal_length", c = "petal_width", color = "species", size = "petal_length", symbol = "species_id")plot.show() |
Выход:
Внимание компьютерщик! Укрепите свои основы с помощью базового курса программирования Python и изучите основы.
Для начала подготовьтесь к собеседованию. Расширьте свои концепции структур данных с помощью курса Python DS. А чтобы начать свое путешествие по машинному обучению, присоединяйтесь к курсу Машинное обучение - базовый уровень.