Функция Matplotlib.pyplot.subplot () в Python
Предварительные требования: matplotlib
Функция subplot () добавляет подзаголовок к текущей фигуре в указанной позиции сетки. Она похожа на функцию subplots (), но, в отличие от subplots (), добавляет по одной подзаголовке за раз. Итак, чтобы создать несколько графиков, вам понадобится несколько строк кода с функцией subplot (). Еще один недостаток функции subplot заключается в том, что она удаляет ранее существовавший график на вашей фигуре. См. Пример 1.
Это оболочка Figure.add_subplot.
Синтаксис:
subplot(nrows, ncols, index, **kwargs)
subplot(pos, **kwargs)
subplot(ax)
Parameters :
- args: Either a 3-digit integer or three separate integers describing the position of the subplot.
- pos is a three-digit integer where the first, second, and third integer are nrows,ncols, index.
- projection : [{None, ’aitoff’, ’hammer’, ’lambert’, ’mollweide’, ’polar’, ’rectilinear’, str}, optional]. The projection-type of the subplot (Axes). The default None results in a ’rectilinear’ projection.
- label : [str] A label for the returned axes.
- **kwargs: This method also takes the keyword arguments for the returned axes base class;
except for the figure argument, for e.g facecolor.Returns : An axes.SubplotBase subclass of Axes or a subclass of Axes. The returned axes base class depends on the projection used.
Реализация функции представлена ниже:
Example 1: subplot() will delete the pre-existing plot.
Python3
# importing hte moduleimport matplotlib.pyplot as plt # Data to display on plotx = [1, 2, 3, 4, 5]y = [1, 2, 1, 2, 1] # plot() will create new figure and will add axes object (plot) of above dataplt.plot(x, y, marker="x", color="green") # subplot() will add plot to current figure deleting existing plotplt.subplot(121) |
Вывод: Мы видим, что первый график был отложен функцией subplot ().
subplot_gfg
Если вы хотите, чтобы первый график закомментировал строку plt.subplot (), вы увидите следующий график
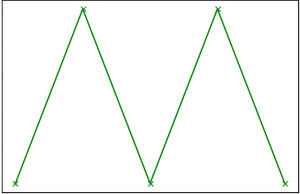
plot_gfg
Example 2:
Python3
import matplotlib.pyplot as plt# data to display on plots x = [3, 1, 3]y = [3, 2, 1]z = [1, 3, 1] # Creating figure objectplt.figure() # addind first subplotplt.subplot(121)plt.plot(x, y, color="orange", marker="*") # addding second subplotplt.subplot(122)plt.plot(z, y, color="yellow", marker="*") |
Выход :
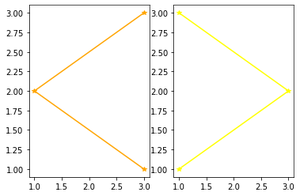
multiple_subplots
Внимание компьютерщик! Укрепите свои основы с помощью базового курса программирования Python и изучите основы.
Для начала подготовьтесь к собеседованию. Расширьте свои концепции структур данных с помощью курса Python DS. А чтобы начать свое путешествие по машинному обучению, присоединяйтесь к курсу Машинное обучение - базовый уровень.