Функция Matplotlib.axis.Axis.set_path_effects () в Python
Matplotlib - это библиотека на Python, которая является численно-математическим расширением библиотеки NumPy. Это потрясающая библиотека визуализации на Python для 2D-графиков массивов, используемая для работы с более широким стеком SciPy.
Функция Matplotlib.axis.Axis.set_path_effects ()
Функция Axis.set_path_effects () в модуле оси библиотеки matplotlib используется для установки эффектов пути.
Syntax: Axis.set_path_effects(self, path_effects)
Parameters: This method accepts the following parameters.
- path_effects : This parameter is the AbstractPathEffect.
Return value: This method does not return any value.
Примеры ниже иллюстрируют функцию matplotlib.axis.Axis.set_path_effects () в matplotlib.axis:
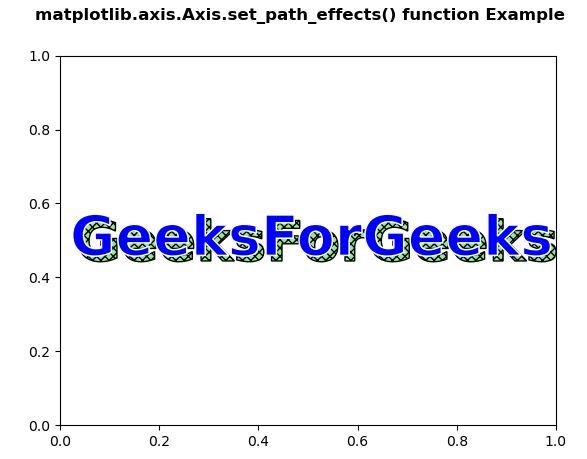
Example 1:
Python3
# Implementation of matplotlib functionfrom matplotlib.axis import Axisimport matplotlib.pyplot as plt import numpy as np import matplotlib.patheffects as path_effects fig, ax = plt.subplots() t = ax.text(0.02, 0.5, "GeeksForGeeks", fontsize = 40, weight = 1000, va ="center") Axis.set_path_effects(t, [path_effects.PathPatchEffect(offset =(4, -4), hatch ="xxxx", facecolor ="lightgreen"), path_effects.PathPatchEffect(edgecolor ="white", linewidth = 1.1, facecolor ="blue")]) fig.suptitle("matplotlib.axis.Axis.set_path_effects() function Example
", fontweight ="bold") plt.show() |
Выход:
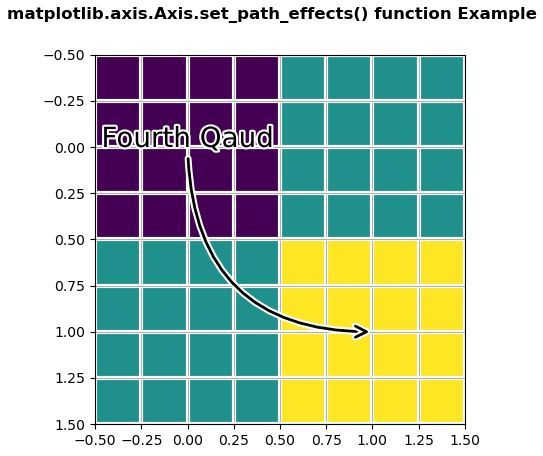
Example 2:
Python3
# Implementation of matplotlib functionfrom matplotlib.axis import Axisimport matplotlib.pyplot as plt import matplotlib.patheffects as PathEffects import numpy as np fig, ax1 = plt.subplots() ax1.imshow([[1, 2], [2, 3]]) txt = ax1.annotate("Fourth Qaud", (1., 1.), (0., 0), arrowprops = dict(arrowstyle ="->", connectionstyle ="angle3", lw = 2), size = 20, ha ="center", path_effects =[PathEffects.withStroke(linewidth = 3, foreground ="w")]) Axis.set_path_effects(txt.arrow_patch, [ PathEffects.Stroke(linewidth = 5, foreground ="w"), PathEffects.Normal()]) ax1.grid(True, linestyle ="-") pe = [PathEffects.withStroke(linewidth = 3, foreground ="w")] for l in ax1.get_xgridlines() + ax1.get_ygridlines(): Axis.set_path_effects(l, pe) fig.suptitle("matplotlib.axis.Axis.set_path_effects() function Example
", fontweight ="bold") plt.show() |
Выход:
Внимание компьютерщик! Укрепите свои основы с помощью базового курса программирования Python и изучите основы.
Для начала подготовьтесь к собеседованию. Расширьте свои концепции структур данных с помощью курса Python DS. А чтобы начать свое путешествие по машинному обучению, присоединяйтесь к курсу Машинное обучение - базовый уровень.