Функция Matplotlib.axis.Axis.have_units () в Python
Matplotlib - это библиотека на Python, которая является численно-математическим расширением библиотеки NumPy. Это потрясающая библиотека визуализации на Python для 2D-графиков массивов, используемая для работы с более широким стеком SciPy.
Функция Matplotlib.axis.Axis.have_units ()
Функция Axis.have_units () в модуле оси библиотеки matplotlib используется для проверки, установлены ли единицы на какой-либо оси.
Syntax: Axis.have_units(self)
Parameters: This method does not accepts any parameter.
Return value: This method return True if units are set on any axis.
Примеры ниже иллюстрируют функцию matplotlib.axis.Axis.have_units () в matplotlib.axis:
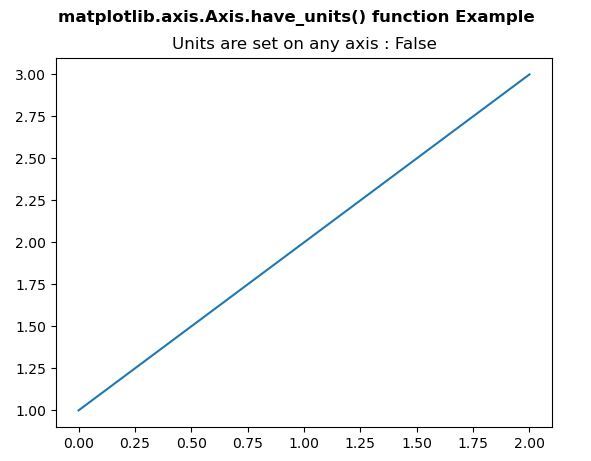
Example 1:
Python3
# Implementation of matplotlib functionfrom matplotlib.axis import Axisimport matplotlib.pyplot as plt fig, axs = plt.subplots() axs.plot([1, 2, 3]) axs.set_title("Units are set on any axis : " +str(axs.xaxis.have_units())) fig.suptitle("matplotlib.axis.Axis.have_units() function Example
", fontweight ="bold") plt.show() |
Выход:
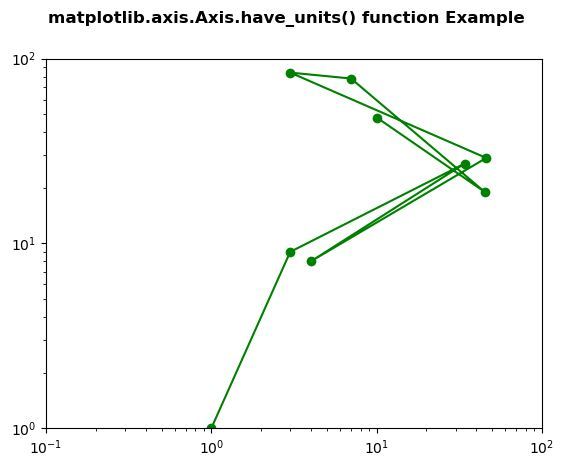
Example 2:
Python3
# Implementation of matplotlib functionfrom matplotlib.axis import Axisimport matplotlib.pyplot as plt fig, ax1 = plt.subplots( ) ax1.set_xscale("log") ax1.set_yscale("log") ax1.set_adjustable("datalim") ax1.plot([1, 3, 34, 4, 46, 3, 7, 45, 10], [1, 9, 27, 8, 29, 84, 78, 19, 48], "o-", color ="green") ax1.set_xlim(1e-1, 1e2) ax1.set_ylim(1, 1e2) w = Axis.have_units(ax1.yaxis) print("Value Return by have_units() :", w) fig.suptitle("matplotlib.axis.Axis.have_units() function Example
", fontweight ="bold") plt.show() |
Выход:
Внимание компьютерщик! Укрепите свои основы с помощью базового курса программирования Python и изучите основы.
Для начала подготовьтесь к собеседованию. Расширьте свои концепции структур данных с помощью курса Python DS. А чтобы начать свое путешествие по машинному обучению, присоединяйтесь к курсу Машинное обучение - базовый уровень.