Matplotlib.axes.Axes.set_title () в Python
Matplotlib - это библиотека на Python, которая является численно-математическим расширением библиотеки NumPy. Класс Axes содержит большинство элементов фигуры: Axis, Tick, Line2D, Text, Polygon и т. Д. И задает систему координат. А экземпляры Axes поддерживают обратные вызовы через атрибут callbacks.
Функция matplotlib.axes.Axes.set_title ()
Функция Axes.set_title () в модуле осей библиотеки matplotlib используется для установки заголовка осей.
Syntax: Axes.set_title(self, label, fontdict=None, loc=’center’, pad=None, **kwargs)
Parameters: This method accepts the following parameters.
- label : This parameter is the Text to use for the title.
- fontdict : This parameter is the dictionary controlling the appearance of the title text.
- loc : This parameter is used to set the location of the title {‘center’, ‘left’, ‘right’}.
- pad : This parameter is the offset of the title from the top of the axes, in points.
Returns:This method returns the matplotlib text instance representing the title.
Примеры ниже иллюстрируют функцию matplotlib.axes.Axes.set_title () в matplotlib.axes:
Example 1:
# Implementation of matplotlib functionimport osfrom matplotlib import font_manager as fm, rcParamsimport matplotlib.pyplot as plt fig, ax = plt.subplots() fpath = os.path.join(rcParams["datapath"], "fonts/ttf/cmr10.ttf") prop = fm.FontProperties(fname = fpath)fname = os.path.split(fpath)[1]ax.set_title("Title with special font: {}".format(fname), fontproperties = prop, fontsize = 14) plt.show() |
Выход: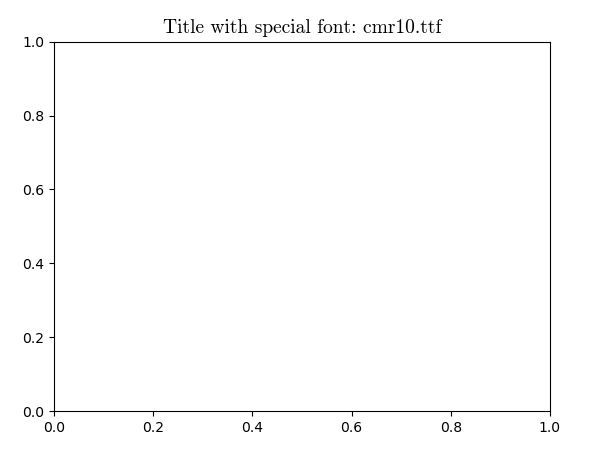
Example 2:
# Implementation of matplotlib functionimport numpy as npimport matplotlib.pyplot as plt x = np.arange(0.1, 5, 0.1)y = np.exp(-x) yerr = 0.1 + 0.1 * np.sqrt(x) fig, axs = plt.subplots(nrows = 1, ncols = 2, sharex = True)ax = axs[0]ax.errorbar(x, y, yerr = yerr, color ="green")ax.set_title("Title of Axes 1", fontweight ="bold") ax = axs[1]ax.errorbar(x, y, yerr = yerr, errorevery = 5, color ="green") ax.set_title("Title of Axes 2", fontweight ="bold") fig.suptitle("matplotlib.axes.Axes.set_title() function Example
") plt.show() |
Выход: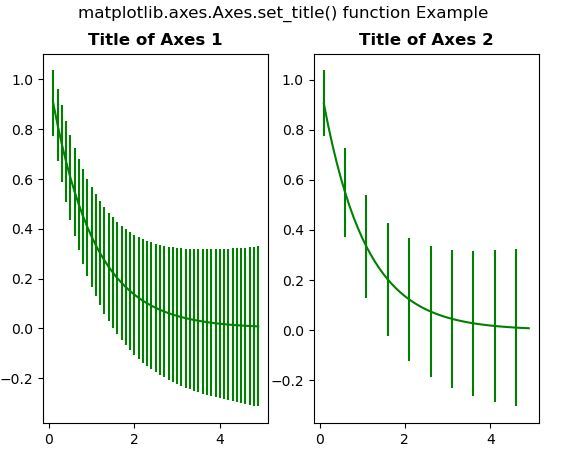
Внимание компьютерщик! Укрепите свои основы с помощью базового курса программирования Python и изучите основы.
Для начала подготовьтесь к собеседованию. Расширьте свои концепции структур данных с помощью курса Python DS. А чтобы начать свое путешествие по машинному обучению, присоединяйтесь к курсу Машинное обучение - базовый уровень.